
Expand Configuration and Management Manual (H06.21+, J06.10+)


Tuning
Expand Configuration and Management Manual — 529522-013
19 - 33
Example 2: Reducing Passthrough Traffic
Example 19-8 shows the true overhead produced by passthrough traffic for an entire
network. The route between \OAHU and \HERE consists of four hops because three
intermediate nodes and six Expand line-handler processes handle every message
between \OAHU and \HERE. For the network as a whole, 75 percent of the processor
overhead for traffic between \OAHU and \HERE is handled by the intermediate nodes.
A more efficient routing scheme could be att
ained by installing a new path between
\OAHU and \HERE. By directly connecting \OAHU and \HERE, applications on
intermediate nodes would gain better response time, overall transaction overhead
would be reduced, circuit reliability would be greatly improved, the number of
retransmissions because of Layer 4 timeouts and line failures would be reduced, and
network management overhead would be eased.
The type of analysis and subsequent tuning shown in this example is not always
possible because few networks can be fully connected or meshed to eliminate
passthrough traffic. However, routinely studying simple summaries such as this one
and accurately calculating the true overhead produced by a multiple-hop circuit often
reveals that the cost of additional communications lines is more than offset by benefits
such as those cited above. This is particularly true in the United States, where the cost
of long communications links is decreasing.
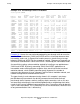
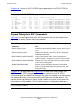
Example 19-8. Passthrough Traffic in a Network
Local System \HERE
Frames % Send % Send Rcv % Rcv
Remote Msgs Rcvd Frames Frames Total Pass Pass Pass Pass
System Sent Sent Rcvd Rcvd Hops Thru Thru Thru Thru
----------------------------------------------------------------------------
\OAHU 40856 87030 81732 9.87% 4 522180 10.14% 490392 14.37%
\CANTON 39259 79444 78637 9.50% 4 476664 9.25% 471822 13.83%
\SAIPAN 10438 76652 77156 9.32% 1 0 0.00% 0 0.00%
\WAKE 21888 90266 72997 8.82% 1 0 0.00% 0 0.00%
\MAUI 36327 73565 72830 8.80% 4 441390 8.57% 436980 12.81%
\HOME 33113 69507 66592 8.04% 4 417042 8.10% 399552 11.71%
\UIST 32536 67577 64460 7.79% 4 405462 7.87% 386760 11.33%
\ROSS 10401 28964 62856 7.59% 2 57928 1.12% 125712 3.68%
\ATTU 24123 113862 48640 5.87% 5 910896 17.68% 389120 11.40%
\ARAN 15023 42482 30128 3.64% 5 339856 6.60% 241024 7.06%
\JERSEY 3 55901 25063 3.03% 1 0 0.00% 0 0.00%
\BLOCK 4222 25134 23663 2.86% 1 0 0.00% 0 0.00%
\ALCA 269 56364 22189 2.68% 1 0 0.00% 0 0.00%
\TRAZ 3 51155 20649 2.49% 1 0 0.00% 0 0.00%
\KISKA 8236 71395 16628 2.01% 3 285580 5.54% 66512 1.95%
\HONSHU 7364 38922 15157 1.83% 4 233532 4.53% 90942 2.67%
\NOMAN 6938 14883 13932 1.68% 4 89298 1.73% 83592 2.45%
\MOGMOG 4603 27432 10078 1.22% 4 164592 3.19% 60468 1.77%
\CONEY 3229 32742 7161 0.86% 4 196452 3.81% 42966 1.26%
\KARGH 2706 26766 6313 0.76% 4 160596 3.12% 37878 1.11%
\ARMAGH 2617 27866 5568 0.67% 5 222928 4.33% 44544 1.31%
\GEDDON 2660 28414 5504 0.66% 5 227312 4.41% 44032 1.29%
========================================================================
Total 306814 1186323 827933 100% 71 5151708 100% 3412296 100%