
Migrating from Inspect to Native Inspect

Migrating from Inspect to Native Inspect
8 of 15 Hewlett-Packard Company 543427-002
Machine-Level Debugging
Sometimes viewing your program execution
at the source level might be insufficient, and
instead you need to see how the machine is
executing the compiler-translated
instructions. Doing so reveals the much
larger register file, longer instruction
sequences, and compiler optimizations
inherent to TNS/E processors.
Whereas Inspect supported a low-level
mode for this purpose, machine-level
debugging commands are integrated into
Native Inspect.
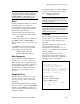
Examining Memory
Use the “eXamine”, x, command to display
memory at a specified address. It accepts an
optional formatting clause and address:
x [[/NFU] address]
N is an optional count of the number of
memory units to display.
F is an optional letter that controls the
formatting of the memory. The
following values are recognized in
addition to the fmt letters recognized by
the print command:
fmt Radix
i Instruction
s String
U is an optional letter that controls the
memory unit size to display:
Unit Size
b Byte
h Half-word
w Word
g Giant (8 bytes)
For example,
x /10 0x8001ac0
x /5cb 0x8001ac0
GDB Gotcha: When you do not specify a
format or size, the last value specified to the x
command is used. When you omit address, the
address following the last displayed address is
used.
To specify an address to the print command,
use this syntax:
print *address
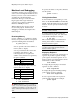
Listing Instructions
To list instructions corresponding to source
lines, use the disassemble command. By
default, it lists all instructions for the current
function. You can specify an address range,
however.
Tip: To determine the address range of a line, use
the info line command.
To display instructions surrounding the
current instruction pointer, it is often easier
to use the x command. For example:
x /4i $ip
This command displays four instructions
starting at the address contained in the
Instruction Pointer register.
Inspect Difference: When a breakpoint is set,
you will see the breakpoint rather than the
instruction that it replaces.
Displaying Registers
A TNS/E processor has 128 general-purpose
registers, 64 predicate registers, floating-
point registers, and status registers. To see
the key registers associated with the current
stack frame, use this command:
info frame
To display all general-purpose and status
registers, use this command:
info registers
To display all registers including floating-
point registers, use this command:
info all-registers
To use a register value in an expression,
prefix its name with a $. For example:
print $gr4