
NonStop Server for Java 6.0 Programmer's Reference


Debugging Java Programs
This subsection discusses the debugger architecture and how to run the programs involved in
debugging Java applications. The topics are:
• “Debugging Overview” (page 54)
• “Transports” (page 55)
• “java Command Line Options to Run a Debuggee” (page 55)
• “Starting the Java Debugger (jdb) Tool” (page 57)
• “Debugging JNI Code” (page 57)
• “Debugging Java and JNI Code” (page 58)
Debugging Overview
NonStop Server for Java 6.0 supports Java Platform Debugger Architecture (JPDA) that provides
debugging support for the Java platform. JPDA consists of a three-layered set of APIs:
JDI
Java Debug Interface—A high-level Java language interface, includes support for
remote debugging that is used by debugger applications
JDWP
Java Debug Wire Protocol—Defines the format of the request between the debugger
and the debuggee (the application that is being debugged)
JVM TI
Java Virtual Machine Tool Interface—A programming interface used by development
and monitoring tools that provides both a way to inspect the state and to control
the execution of applications running in the Java VM, and thereby, defines the
debugging services a VM provides.
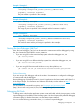
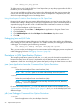
The structure of JPDA is shown in the diagram below.
The Java Platform Debugger Architecture Structure
54 Implementation Specifics