
NonStop Servlets for JavaServer Pages (NSJSP) 6.1 System Administrator's Guide


Managing NSJSP
NonStop Servlets for JavaServer Pages (NSJSP) 6.1 System Administrator’s Guide—596210-006
4-15
NSJSP Manager Operations
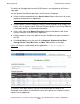
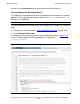
The details of the application for each NSJSP process are displayed on the Process
View page.
You can perform the following operations on the Process View page:
Click the value corresponding to the Servlet Count: field to view the list of servlet
mappings configured for an application.
Click the process name to display the Process Summary page, which displays the
details, such as, process name, CPU and PIN of the process, Java Virtual Machine
(JVM) heap statistics, and connector information.
Click a value from the In Memory Sessions column of the table to view all the
sessions currently in memory for an application.
Click the requests value in the table to view the distribution of requests based on
the URI.
Click Reset Stats to reset the value of the Requests, Request Arrival Rate,
Average Service Time, Min. Time, and Max. Time columns in the table.
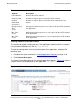
Figure 4-5 shows a sample output for the application, /sca6url/examples.
The Process View page displays statistics that indicate how the requests are
distributed across processes and how the server class processes are processing the
requests for the application.
Note. A servlet can have multiple servlet mappings configured for it.
Figure 4-5. Application Summary Page After Clicking Process View