
NonStop Servlets for JavaServer Pages (NSJSP) 6.1 System Administrator's Guide

Managing NSJSP
NonStop Servlets for JavaServer Pages (NSJSP) 6.1 System Administrator’s Guide—596210-006
4-33
Viewing Details of the NSJSP Connector Statistics
The connector statistics provides a good indication of the incoming request workload
for individual NSJSP processes. Since all requests to all the deployed applications in a
server class process have to pass through the connector, the connector counters
provide a good indication of how many requests have been processed across all the
applications deployed.
For more information on connectors, see Chapter 1, Introduction to NSJSP.
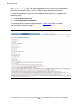
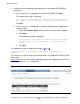
To view the details of the NSJSP connector statistics, complete the following steps:
1. Click the Server Class tab.
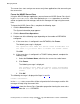
2. Click NSJSP Connector Stats.
The NSJSP Connector Stats page appears. Figure 4-19 shows a sample NSJSP
Connector Stats page.
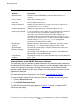
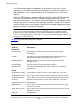
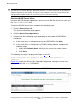
Table 4-15. Attributes in the Server Class Processes Page
Attribute Description
Pathmon Name Identifies in which PATHMON a particular NSJSP process is
running.
Process Name Name of the NSJSP process.
CPU, PIN CPU and PIN of the process.
Request Not Read Number of requests that are yet to be read. These requests are
currently in the $RECEIVE queue.
Request Not Replied Number of requests that are currently being processed.
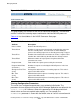
Request Open Depth It is also called the receive depth. It is the maximum the number of
messages that can be read before replying to any read
messages. In the NSJSP context, this number indicates the
maximum number of requests that can be processed by a server
class process in parallel. This is a static counter and the number is
derived from the TANDEM_RECEIVE_DEPTH configuration
parameter of the NSJSP Server Class.
Max Memory
(in Bytes)
Maximum memory allowed for the JVM heap. The value is deter-
mined by the -Xmx command-line parameter for the JVM.
Total Allocated
Memory (in Bytes)
The amount of heap that the JVM has allocated out of the maxi-
mum allowed heap.
This component also displays the percentage of Total Allocated
Memory with respect to Max Memory.
Used Memory
(in Bytes)
The amount of heap in use out of the total heap currently allocated
by the JVM.