
Troubleshooting the SLSA Subsystem
Tracing SLSA Subsystem Processes and Objects
You can trace the activity of the following ServerNet LAN Systems Access (SLSA)
subsystem processes and objects:
LAN manager process ($ZZLAN)●
LAN monitor processes●
Physical interfaces (PIFs)●
ServerNet addressable controllers (SACs)●
Tracing enables you to see the history of a SLSA subsystem process or object, including
significant points in the internal processing of the traced entity.
Tracing Guidelines
For tracing to be an effective, fault-finding tool, make sure you follow these guidelines:
Ensure that all traces for a particular problem are taken at the same time.●
If the data rate is high or if the trace is expected to run for many hours, preallocate the
file space for the trace file using the File Utility Program (FUP). A 3-megabyte or
4-megabyte file is generally sufficient for all but the longest or most work-intensive
traces.
●
You can initiate or terminate a trace on a SAC while the SAC is in any state. The
trace on a SAC is terminated automatically when it is deleted along with its parent
adapter, its ownership switches to a different processor, or the trace file becomes full
and no WRAP option was specified when the trace was initiated.
●
You can have a maximum of 64 open traces for SAC, PIF, and LIF objects in a single
processor.
●
You cannot execute a trace on a PIF until its parent SAC is in the STARTED state.
The trace of a PIF terminates automatically when the parent SAC is no longer in the
STARTED state, the data path to the SAC switches to a different process (that is, an
ownership change occurs), or the trace file becomes full and you did not specify the
WRAP option when the trace was initiated.
●
Trace files can be displayed using the commands available in the PTrace program. For
information about PTrace, see the PTrace Reference Manual. For information about the
SCF TRACE command, see the configuration and management manual for the
communications subsystem you want to trace.
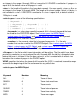
Tracing Command Syntax
Tracing a SLSA subsystem process or object is initiated using the SCF TRACE command: