
Troubleshooting the SLSA Subsystem


Example: Displaying Detailed Status for a PIF
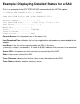
This is an example of the SCF STATUS PIF command with the DETAIL option:
-> STATUS PIF $ZZLAN.E0153.1.A, DETAIL
SLSA Detailed Status PIF \FUDD.$ZZLAN.E0153.1.A
CPUs with Data Path...... ( 0, 1 )
Interface Status.........
Last Error............... (3, LANMON, 2038)
State.................... STARTED
Trace Filename...........
Trace Status............. OFF
E4SA-Specific Information:
Link Pulse State......... UP
TRSA-Specific Information:
Ring State ................ OPENED
Ring Open State ........... OPEN SUCCESSFUL
Last Ring Status .......... NO PROBLEMS
FESA-Specific Information:
Duplex ................. HALF
Line Speed ............. 100 Mbit/sec
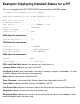
CPUs with Data Path indicates the processors in the acess list.
Interface Status indicates the status of the PIF.
Last Error provides error information in the form (<severity>,<origin>,<errorcode>). A value
of (0,0,0) indicates that no errors have occurred.
State indicates the current state of the PIF.
Trace Filename is the name of the file that stores trace information for the PIF.
Trace Status indicates whether tracing is enabled for the PIF.
Link Pulse State indicates the current state of the link pulse on the physical Ethernet link.
Ring State indicates the current state of the token ring.
Ring Open State indicates the success, or the reason for the failure, of the adatper's most
recent attempt to enter the token ring.