
HP CloudSystem Matrix/Matrix Operating Environment 7.1 Integration Interfaces API and CLI Operations Reference Guide
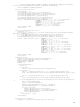


usageReport.generate (self.format_data(), outputfile)
class AggregateUsageReport (object):
def __init__ (self, periodInformation, connection, filters=None, title="Title", footer="Footer"):
self.title = title
self.data = footer
self.footer = ""
self.period = periodInformation
self.filters = filters
self.chargebackservice = connection.client
def drawpiechart(self, labels, data):
pie_chart = Drawing(200, 200)
pc = Pie()
pc.width = 150
pc.height = 150
pc.data = data
pc.labels = labels
pc.simpleLabels = 1
pc.slices.label_visible = 0
pc.slices.strokeWidth = 1
pc.slices.strokeColor = white
pie_chart.add(pc)
pie_chart.hAlign = "CENTER"
legend = Legend()
legend.fontSize = 6
legend.strokeWidth = 1
legend.autoXPadding = 5
legend.dxTextSpace = 5
legend.strokeColor = black
legend.alignment = 'right'
legend.columnMaximum = 4
data_size = len(pc.data)
colorsnumber = len (pdf_chart_colors)
colorinterval = colorsnumber // data_size
for j in xrange(data_size):
setattr(pc.slices[j], 'fillColor', pdf_chart_colors[j*colorinterval % colorsnumber] )
legend.colorNamePairs = [(pc.slices[i].fillColor, (pc.labels[i][0:20], str(locale.currency(val=pc.data[i],
symbol=False, grouping=True)))) for i in xrange(data_size)]
pie_chart.add(legend,name='legend')
return pie_chart
def format_data(self):
dataPeriod = self.period.getPeriodObj(self.chargebackservice)
Elements = []
if self.chargebackservice :
filters = []
if self.filters :
filters = self.filters.getFiltersObj(self.chargebackservice)
if len(filters) > 0:
print "[" + str(datetime.datetime.now()) + "]" + "getAggregateServiceUsage: start"
result = self.chargebackservice.service.getAggregateServiceUsage(dataPeriod, filters)
print "[" + str(datetime.datetime.now()) + "]" + "getAggregateServiceUsage: end"
else:
result = self.chargebackservice.service.getAggregateServiceUsage(dataPeriod)
Elements.extend(report_Summary(result.servicesCount, self.period))
Elements.append(Paragraph(''' ''', styleSheet["BodyText"]))
Elements.append(Paragraph("Cost distribution by resource types for the reporting period",
styleSheet["Heading2"]))
chartlabels = ["Server allocation cost", "Disk allocation cost", "IPAddress allocation cost", "Fixed
cost"]
chartdata = [result.resourceUsageSummary.ServerUsageSummary.allocationCost,
result.resourceUsageSummary.DiskUsageSummary.allocationCost,
result.resourceUsageSummary.IpAddressUsageSummary.allocationCost,
result.resourceUsageSummary.fixedCost]
Elements.extend([self.drawpiechart(chartlabels, chartdata)])
return Elements
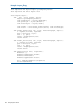
def generate (self, outputfile):
usageReport = root.reports.reports.Report(self.title, self.footer)
usageReport.generate (self.format_data(), outputfile)
102 Sample Python Client