
HP Integrity Essentials Global Workload Manager: Workload Management for HP Integrity Virtual Machines

9
2. Set SRD properties such as the SRD name, mode, state, and resource allocation interval, and
whether to use Temporary Instant Capacity (the latter will be used in Scenario 3). To manage
virtual machines, you must set the mode to managed; the defaults for other options are acceptable
for virtual machines. (The other mode setting is advisory mode, which is not available for SRDs
containing virtual machines, PSETs, or FSS groups.)
3. Specify workload and policy settings. Workload settings include the compartment type, which you
would select as “HPVM”. (A gWLM compartment is an nPartition, virtual partition, virtual
machine, PSET, or FSS group. Multiple compartments are grouped to share resources within an
SRD. gWLM manages each workload by adjusting the resource allocation for its compartment.)
For each workload, a drop-down menu allows you to select from a list of policies; or you can
choose to create your own policy. When you define your own policy, the wizard prompts you for
the various policy parameters. Create your policies by following the steps described in the gWLM
documentation, available from:
http://docs.hp.com/en/vse.html
4. Review the SRD and workload settings to confirm.
Adding a Virtual Machine to the VM Host’s SRD
Assume you have configured a new virtual machine on your Integrity VM Host and want to add it to
the gWLM-managed collection. Use the wizard to add the new virtual machine as a VSE workload in
the SRD by selecting the “Add VM…” button and then selecting the virtual machine to be added.
Assign a policy to the virtual machine (step 3, above, select your custom-defined policy or create a
new one specific for this workload). The new virtual machine must have a policy before you can start
it (for more information, see “Notes Regarding gWLM Management of Virtual Machine Workloads”
on page 5).
Viewing the Behavior of the Virtual Machine Workloads Under gWLM
Control
gWLM provides real-time and historical reports showing resource utilization and resource allocation
profiles. These reports are accessible through the VSE Management menu bar available in a web
browser accessing the CMS. For example, to view gWLM allocations and virtual machine utilization
over time, you can have gWLM generate a historical Workload Utilization graph.
To view gWLM reports:
1. Access the VSE Management menu bar and select the Shared Resources Domain tab.
2. If you want a real-time report, select the workload for which you want a report; otherwise, skip to
the next step.
3. From the VSE management menu bar, select Report and then select the type of report you want.
gWLM’s historical reports are detailed and can be used for internal chargeback in a centralized-IT
environment – for example, gWLM reports show which application instances borrow or lend excess
resources and show that an application instance got its owned resources whenever it required them.
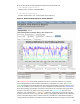
These reports can also help you understand better how gWLM policies work. Figure 1 shows the
graph that is included in the historical report for a virtual machine workload named tara102, which
has a policy named “Own0.3Min0.1Max1.98”. The gWLM policy defines an owned value of 0.3,
meaning that the workload is provided 0.3 cores when needed. The policy minimum is 0.1, which is
the amount of cores owned by that workload even when the virtual machine is not busy; this value
determines how much the workload can lend. The policy maximum of 1.98 is the limit upon
borrowing: the workload can borrow as long as its consumption does not exceed 1.98 cores. The
graph in Figure 1 shows the historical allocation over a two-day period, giving you a good look at
how the workload’s policy is faring. Not shown in this figure is other information reported with the
graph, such as policy changes.