
HP Capacity Advisor 7.2 User Guide


2. If you have pre-selected the scenarios (on the Planning tab) that you want to compare, review
the information displayed on this screen. If it is satisfactory, go to step 5 to set the date range.
If you need to select scenarios to compare, continue with step 2.
Want to compare more than four scenarios?:
One way to do this is to run and save multiple reports, and then print them out to compare
them side-by-side. For example, to compare six scenarios, run one report with four scenarios
and one report with two scenarios. Lay the printouts side-by-side to compare various aspects
of the scenarios.
3. Select Edit Scenario Selection.
A new screen appears showing the possible scenarios to include in the comparison report.
4. Check the box to the left of the scenarios to include.
5. Choose one of the following actions:
• Press OK to accept the selections and return to the Select Report Targets screen. A Date
Selection area appears in the screen.
• Press Cancel to end the report creation and return to your originating screen.
6. To set the date range, look at the default provided (the full range of data collected). Decide
if you want to modify this value. If so, select the beginning and ending date/time.
7. Click Next to continue to the Select Report Options screen.
Procedure 21 Selecting report details in a scenario comparison
All resource metric options are available in a scenario comparison. All selectable fields are
combined into one section called General Report Options.
1. Put a check in the box(es) next to the resource types that you want to compare.
2. If you selected the Power resource type, fill in the Currency, Cost per kWh, and Cooling Cost
Multiplier values. For detailed discussion of the available power options, see Power Report
Options.
3. Choose the scale (absolute utilization numbers, percent of allocated resources used, or both).
4. Select Finish to create and complete the report.
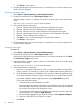
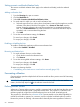
An example scenario comparison report
The following image illustrates one small part of a scenario comparison report.
Figure 6 Comparison of three scenarios in a Capacity Advisor report
This report includes two consolidation solutions provided by the Smart Solver
(ServerConsolidationResult-SmallSystem and ServerConsolidationResults-BigSystem) and the original
Producing graphs and reports 53