
HP Capacity Advisor 7.2 User Guide
2. Specify an appropriate range of data to base the forecast on in the Forecast Data Range
Selection fields.
3. Provide Annual Projected Growth Rates for each of the utilization resources (CPU, memory,
network I/O, disk I/O). You may want to use trend data derived from analyzing historical
data to help you estimate future growth (see “Forecasting growth” (page 34)).
4. Click OK.
Disabling a forecast model
While it is not possible to delete a forecast model, forecast models at all levels below the global
forecast model can be disabled by accessing the appropriate forecast model and using the following
procedure.
1. Click the Disable radio button.
2. Click OK.
Enabling a forecast model
If you have previously disabled a forecast model, you can re-enable it by accessing the appropriate
forecast model and using the following procedure.
1. Click the Enable radio button.
2. Click OK.
Generating forecasts
Once you have defined one or more forecast models, you can view the results of the forecast
models two ways:
• For a quick view, “Viewing forecast data in a profile viewer”
• For a more thorough report, “Viewing forecast data in a utilization report” (page 64)
Viewing forecast data in a profile viewer
A profile viewer provides a quick view of resource utilization for a system, complex, or workload.
Once the profile viewer is posted, you can view the forecast by extending the date range into the
future.
Prerequisites:
• You must be in a profile viewer. (See “Using the Profile Viewer” (page 46).)
• Change the Time Frame and/or Interval and/or Beginning and/or Ending for the profile to
include future dates and/or times. If necessary, click the Refresh button.
The graph will be updated. Historical utilization data will be plotted on a white background
and forecast data will be plotted on a light blue background.
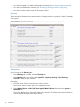
Viewing forecast data in a utilization report
Use the procedure specified in “Creating an historic utilization report” (page 51) and specify
Ending (and possibly Beginning) times under Date Selection to include future times.
Historical utilization data will be plotted on a white background and forecast data will be plotted
on a light blue background.
Working with scenarios
Scenarios are collections of systems and workloads, both real and “what-if” creations. While
scenarios are based on real data, you can modify parameters to model changes to the environment
and the configuration of systems and workloads without affecting the real systems that the scenario
is based upon.
64 Procedures