
HP Integrity Virtual Machines Manager 4.3 User Guide
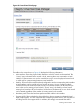
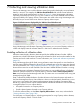


Figure 63 View Capacity Advisor data screen: lower half
The data collection view is provided by the Capacity Advisor Profile Viewer. The Profile
Viewer displays historical utilization data along with additional information you provide.
The Profile Viewer also enables you to examine different time intervals and different
categories of data. In the Capacity Advisor graphs, you can view utilization data for
both CPUs and memory. You can also view network and disk bandwidth utilization
(throughput) for whole OS profiles. For more information about the Capacity Advisor
Profile Viewer, see the HP Capacity Advisor 7.0 User Guide or the Capacity Advisor
Profile Viewer Screen help topic.
When you click the View→Capacity Advisor Data... menu item without any virtual machines
selected on the current tab, the screen shows utilization data pertaining to the VM Host.
The data provided by the View→Capacity Advisor Data... menu item is similar to what
is provided by clicking on a utilization meter. However, clicking on a meter presets certain
parameters, such as what type of utilization metric to display and for which system (VM
Host or a particular virtual machine, for example). Nevertheless, you can change
parameters once the screen comes up.
◦ You can use the Tools→Capacity Advisor Historic Report menu item to create a
comprehensive report that collects and analyzes data over specified time periods from
specified sources, as described in “Creating a historical utilization data report” (page 110).
The report can be browsed and saved.
Viewing utilization data 109