
HP Integrity Virtual Machines Manager 4.3 User Guide


6
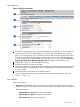
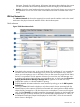
The utilization meter (bar graph) displays network I/O throughput data, if available. The data
is a 5-minute average that is calculated and updated on 5-minute boundaries. If the data
cannot be displayed, the meter is dimmed (as in the meter in the next box below) and a label
indicates the probable cause. For a description of meter labels, see “Utilization meter
status/error information” (page 117).
Using VM Manager with Matrix Operating Environment for HP-UX, you can click a meter to
view a snapshot of Capacity Advisor historical data for network I/O; this feature is not provided
when using VM Manager from HP SMH.
For more information about using VM Manager to collect and view utilization data, see
Chapter 7 (page 105).
7
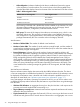
Allows you to perform an action on the virtual machine or I/O device. Select the box, then
select an action from one of the menus available on the VM Manager menu bar.
8
Indicates by color coding that matching components are related.
Network devices
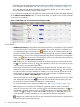
VM Manager displays icons to represent certain network devices. You can hover your cursor over
the icon to see text describing the representation. Table 2 describes these icons.
Table 2 Network device icons
DescriptionIcon
Physical or virtual network card
Virtual switch
Virtual LAN (VLAN)
A question mark within the device icon, such as , indicates that the type of device cannot
be determined. The device type cannot be determined, for example, when the device has been
removed from the VM Host but not from the virtual machine.
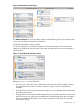
Screen details
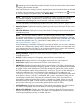
Network tab column layout
Figure 16 depicts the column layout for the VM Host Network tab.
38 Using VM Manager views and tabs