
MSA 2040 SMU Reference Guide

104 Viewing system status
Vdisk performance
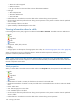
When you select Vdisk in the Vdisk Overview table and click the Performance tab, the Performance Statistics panel
shows three graphs of historical performance statistics for the vdisk: Data Transferred, Data Throughput, and Average
Response Time. Data samples are taken every quarter hour and the graphs represent up to 50 samples.
To specify a time range of samples to display, set the start and end values and click Update. The system determines
whether the number of samples in the time range exceeds the number of samples that can be displayed (50),
requiring aggregation. To determine this, the system divides the number of samples in the specified time range by 50,
giving a quotient and a remainder. If the quotient is 1, the 50 newest samples will be displayed. If the quotient
exceeds 1, each “quotient” number of newest samples will be aggregated into one sample for display. The remainder
is the number of oldest samples that will be excluded from display.
• Example 1: A 1-hour range includes 4 samples. 4 is less than 50 so all 4 samples are displayed.
• Example 2: A 15-hour range includes 60 samples. 60 divided by 50 gives a quotient of 1 and a remainder of 10.
Therefore, the newest 50 samples will be displayed and the oldest 10 samples will be excluded.
• Example 3: A 30-hour range includes 120 samples. 120 divided by 50 gives a quotient of 2 and a remainder of
20. Therefore, each two newest samples will be aggregated into one sample for display and the oldest 20
samples will be excluded.
If aggregation is required, the system aggregates samples for each disk in the vdisk (as described in "Disk
performance" (page 116 )) and then aggregates the resulting values as follows:
• For a count statistic such as data transferred, the aggregated values are added to produce the value of the
aggregated sample.
• For a rate statistic such as data throughput, the aggregated values are added and then are divided by their
combined interval (seconds per sample multiplied by the number of samples).
The system will change the time settings to match the times of the oldest and newest samples displayed. The graphs
are updated each time you click either the Performance tab or the Update button.
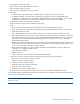
• For the vdisk, the Data Transferred graph shows the amounts of data read and written and the combined total
over the sampling time period. The base unit is bytes.
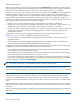
• For the vdisk, the Data Throughput graph shows the rates at which data are read and written and the combined
total over the sampling time period. The base unit is bytes per second.
• For each disk in the vdisk, the Average Response Time graph shows the average response times for reads and
writes over the sampling time period. The base unit is microseconds. To view the graph’s legend, which identifies
the color-coding for each disk, select Show Legend.
TIP: If you specify a time range, it is recommended to specify a range of 12 hours or less.
To view performance data for an individual disk, use the Enclosure Overview panel (page 113). To view live
(non-historical) performance statistics for one more vdisks, in the CLI use the show vdisk-statistics command.
NOTE: Values for the amount of data transferred and for data throughput appear to be much higher in historical
output than in live output. This is caused by a difference in the way that historical and live values are calculated.
Live values are calculated based on the vdisk as viewed from the controller cache perspective. In the live statistics,
performance numbers are obtained by accounting for when data is written from cache to disk or is read from disk to
cache.
Historical data is obtained by using the summation of the disk statistics for the disks in the vdisk. The historical vdisk
data shows transfers to and from the disks in the vdisk that include the overhead of any RAID transfers as well as any
host activity.
Because I/Os from the RAID engine are included, values for the historical data appear higher than the numbers for
the live data.