HP MSR Router Series Network Management and Monitoring Configuration Guide(V5) Part number: 5998-2032 Software version: CMW520-R2511 Document version: 6PW103-20140128
Legal and notice information © Copyright 2014 Hewlett-Packard Development Company, L.P. No part of this documentation may be reproduced or transmitted in any form or by any means without prior written consent of Hewlett-Packard Development Company, L.P. The information contained herein is subject to change without notice.
Contents Configuring SNMP······················································································································································· 1 Overview············································································································································································ 1 SNMP framework ·······································································································································
Disabling an interface from receiving NTP messages ······················································································· 33 Configuring the allowed maximum number of dynamic sessions ···································································· 34 Configuring access-control rights ································································································································· 34 Configuration prerequisites ············································
Configuring CWMP (TR-069) ···································································································································· 73 Overview········································································································································································· 73 CWMP network framework·································································································································· 73 Basic CWMP fu
Flow aging approaches ········································································································································ 97 Configuration procedure ······································································································································ 98 Displaying and maintaining NetStream ······················································································································ 99 NetStream configuration examp
Configuring counter sampling ···································································································································· 147 Displaying and maintaining sFlow ····························································································································· 147 sFlow configuration example ······································································································································ 147 Troubleshooting
Verifying the configuration ································································································································· 170 Configuring traffic mirroring ·································································································································· 171 Overview······································································································································································· 171 Traf
Configuring IPv6 NetStream ·································································································································· 208 Overview······································································································································································· 208 IPv6 NetStream basic concepts ·································································································································· 208 IPv6
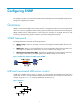
Configuring SNMP This chapter provides an overview of the Simple Network Management Protocol (SNMP) and guides you through the configuration procedure. Overview SNMP is an Internet standard protocol widely used for a management station to access and operate the devices on a network, regardless of their vendors, physical characteristics and interconnect technologies.
A MIB view represents a set of MIB objects (or MIB object hierarchies) with certain access privilege and is identified by a view name. The MIB objects included in the MIB view are accessible while those excluded from the MIB view are inaccessible. A MIB view can have multiple view records each identified by a view-name oid-tree pair. You control access to the MIB by assigning MIB views to SNMP groups or communities.
Step Command Remarks Optional. By default, the SNMP agent is disabled. 2. 3. Enable the SNMP agent. snmp-agent Configure system information for the SNMP agent. snmp-agent sys-info { contact sys-contact | location sys-location | version { all | { v1 | v2c | v3 }* } } You can also enable the SNMP agent by using any command that begins with snmp-agent except for the snmp-agent calculate-password command. Optional. The defaults are as follows: • Contact—null. • Location—null. • Version—SNMPv3.
Step Command Remarks N/A 8. Add a user to the SNMPv3 group. snmp-agent usm-user v3 user-name group-name [ [ cipher ] authentication-mode { md5 | sha } auth-password [ privacy-mode { 3des | aes128 | des56 } priv-password ] ] [ acl acl-number | acl ipv6 ipv6-acl-number ] * 9. Configure the maximum SNMP packet size (in bytes) that the SNMP agent can handle. snmp-agent packet max-size byte-count Optional. By default, the SNMP agent can receive and send SNMP packets up to 1500 bytes.
Step Command Remarks • (Method 1) Create an SNMP community: snmp-agent community { read | write } [ cipher ] community-name [ mib-view view-name ] [ acl acl-number | acl ipv6 ipv6-acl-number ] * Use either method. • (Method 2) Create an SNMP group, and By default, no SNMP group exists. add a user to the SNMP group: 15. Configure the SNMP access right. a.
Configuring SNMP traps The SNMP agent sends traps to inform the NMS of important events, such as a reboot. Traps include generic traps and vendor-specific traps. Available generic traps include authentication, coldstart, linkdown, linkup and warmstart. All other traps are vendor-defined. SNMP traps generated by a module are sent to the information center. You can configure the information center to enable or disable outputting the traps from a module by severity and set output destinations.
Configuring the SNMP agent to send traps to a host The SNMP module buffers the traps received from a module in a trap queue. You can set the size of the queue, the duration that the queue holds a trap, and trap target (destination) hosts, typically the NMS. To successfully send traps, you must also perform the following tasks: • Complete the basic SNMP settings and verify that they are the same as on the NMS. If SNMPv1 or SNMPv2c is used, you must configure a community name.
Displaying and maintaining SNMP Task Command Remarks Display SNMP agent system information, including the contact, physical location, and SNMP version. display snmp-agent sys-info [ contact | location | version ]* [ | { begin | exclude | include } regular-expression ] Available in any view. Display SNMP agent statistics. display snmp-agent statistics [ | { begin | exclude | include } regular-expression ] Available in any view. Display the local engine ID.
Configuration procedure 1. Configure the SNMP agent: # Configure the IP address of the agent, and make sure the agent and the NMS can reach each other. (Details not shown.) # Specify SNMPv1 and SNMPv2c, and create a read-only community public and a read and write community private. system-view [Agent] snmp-agent sys-info version v1 v2c [Agent] snmp-agent community read public [Agent] snmp-agent community write private # Configure contact and physical location information for the agent.
Time Stamp = 8:35:25.68 SNMPv3 configuration example Network requirements As shown in Figure 4, the NMS (1.1.1.2/24) uses SNMPv3 to monitor and manage the interface status of the agent (1.1.1.1/24), and the agent automatically sends traps to report events to the NMS. The NMS and the agent perform authentication when they set up an SNMP session. The authentication algorithm is MD5 and the authentication key is authkey.
{ Set the timeout time and maximum number of retries. For information about configuring the NMS, see the NMS manual. NOTE: The SNMP settings on the agent and the NMS must match. 3. Verify the configuration: # Try to get the count of sent traps from the agent. The get attempt succeeds. Send request to 1.1.1.1/161 ... Protocol version: SNMPv3 Operation: Get Request binding: 1: 1.3.6.1.2.1.11.29.0 Response binding: 1: Oid=snmpOutTraps.
Figure 5 Network diagram Configuration procedure This example assumes that you have configured all required SNMP settings for the NMS and the agent (see "SNMPv1/SNMPv2c configuration example" or "SNMPv3 configuration example"). # Enable displaying log messages on the configuration terminal. (This function is enabled by default. Skip this step if you are using the default.
Field Description node MIB node name and OID of the node instance. errorIndex Error index, with 0 meaning no error. errorStatus Error status, with noError meaning no error. Value set by the SET operation. This field is null for a GET operation. value If the value is a character string that has invisible characters or characters beyond the ASCII range 0 to 127, the string is displayed in hexadecimal format, for example, value = <81-43>[hex].
Configuring RMON Overview Remote Monitoring (RMON) is an enhancement to SNMP for remote device management and traffic monitoring. An RMON monitor, typically the RMON agent embedded in a network device, periodically or continuously collects traffic statistics for the network attached to a port, and when a statistic crosses a threshold, logs the crossing event and sends a trap to the management station. RMON uses SNMP traps to notify NMSs of exceptional conditions.
History group The history group defines that the system periodically collects traffic statistics on interfaces and saves the statistics in the history record table (ethernetHistoryTable). The statistics include bandwidth utilization, number of error packets, and total number of packets. The history statistics table record traffic statistics collected for each sampling interval. The sampling interval is user-configurable.
Private alarm group The private alarm group calculates the values of alarm variables and compares the results with the defined threshold for a more comprehensive alarming function. The system handles the private alarm entry (as defined by the user) in the following ways: • Periodically samples the private alarm variables defined in the private alarm formula. • Calculates the sampled values based on the private alarm formula.
You can successfully create a history control entry, even if the specified bucket size exceeds the history table size supported by the device. However, the effective bucket size will be the actual value supported by the device. • To configure the RMON history statistics function: Step Command 1. Enter system view. system-view 2. Enter Ethernet interface view. interface interface-type interface-number 3. Create an entry in the RMON history control table.
Table 2 RMON configuration restrictions Entry Parameters to be compared Maximum number of entries Event Event description (description string), event type (log, trap, logtrap or none) and community name (trap-community or log-trapcommunity) 60 Alarm Alarm variable (alarm-variable), sampling interval (sampling-interval), sampling type (absolute or delta), rising threshold (threshold-value1) and falling threshold (threshold-value2) 60 Prialarm Alarm variable formula (alarm-variable), sampling interv
Figure 7 Network diagram Configuration procedure # Configure the RMON statistics group on the RMON agent to gather statistics for Ethernet 1/1. system-view [Sysname] interface ethernet 1/1 [Sysname-Ethernet1/1] rmon statistics 1 owner user1 # Display statistics collected by the RMON agent for Ethernet 1/1. display rmon statistics ethernet 1/1 EtherStatsEntry 1 owned by user1-rmon is VALID. Interface : Ethernet1/1
Configuration procedure # Configure the RMON history group on the RMON agent to gather traffic statistics every minute for Ethernet 1/1. Retain up to eight records for the interface in the history statistics table. system-view [Sysname] interface ethernet 1/1 [Sysname-Ethernet1/1] rmon history 1 buckets 8 interval 60 owner user1 # Display the history data collected for Ethernet 1/1.
multicast packets : 6 , CRC alignment errors : 0 undersize packets : 0 , oversize packets : 0 fragments : 0 , jabbers : 0 collisions : 0 , utilization : 0 Sampled values of record 7 : dropevents : 0 , octets : 766 packets : 7 , broadcast packets : 0 multicast packets : 6 , CRC alignment errors : 0 undersize packets : 0 , oversize packets : 0 fragments : 0 , jabbers : 0 collisions : 0 , utilization : 0 Sampled values of record 8 : dropevents : 0 , octets : 1154 packets
[Sysname] snmp-agent target-host trap address udp-domain 1.1.1.2 params securityname public # Configure the RMON statistics group to gather traffic statistics for Ethernet 1/1. [Sysname] interface ethernet 1/1 [Sysname-Ethernet1/1] rmon statistics 1 owner user1 [Sysname-Ethernet1/1] quit # Create an RMON event entry and an RMON alarm entry so the RMON agent sends traps when the delta sampling value of node 1.3.6.1.2.1.16.1.1.1.4.1 exceeds 100 or drops below 50.
Configuring NTP You must synchronize your device with a trusted time source by using the Network Time Protocol (NTP) or changing the system time before you run it on a live network. Various tasks, including network management, charging, auditing, and distributed computing depend on an accurate system time setting, because the timestamps of system messages and logs use the system time. Overview NTP is typically used in large networks to dynamically synchronize time among network devices.
• Prior to the time synchronization, the time of Device A is set to 10:00:00 am and that of Device B is set to 11:00:00 am. • Device B is used as the NTP server. Device A is to be synchronized to Device B. • It takes 1 second for an NTP message to travel from Device A to Device B, and from Device B to Device A. Figure 10 Basic work flow of NTP The synchronization process is as follows: • Device A sends Device B an NTP message, which is timestamped when it leaves Device A.
NTP uses two types of messages: clock synchronization messages and NTP control messages. NTP control messages are used in environments where network management is needed. Because NTP control messages are not essential for clock synchronization, they are not described in this document. A clock synchronization message is encapsulated in a UDP message, as shown in Figure 11. Figure 11 Clock synchronization message format The main fields are described as follows: • LI (Leap Indicator)—A 2-bit leap indicator.
• Precision—An 8-bit signed integer that indicates the precision of the local clock. • Root Delay—Roundtrip delay to the primary reference source. • Root Dispersion—The maximum error of the local clock relative to the primary reference source. • Reference Identifier—Identifier of the particular reference source. • Reference Timestamp—The local time at which the local clock was last set or corrected.
Symmetric peers mode Figure 13 Symmetric peers mode In symmetric peers mode, devices that operate in symmetric active mode and symmetric passive mode exchange NTP messages with the Mode field 3 (client mode) and 4 (server mode). Then the device that operates in symmetric active mode periodically sends clock synchronization messages, with the Mode field in the messages set to 1 (symmetric active).
Multicast mode Figure 15 Multicast mode In multicast mode, a server periodically sends clock synchronization messages to the user-configured multicast address, or, if no multicast address is configured, to the default NTP multicast address 224.0.1.1, with the Mode field in the messages set to 5 (multicast mode). Clients listen to the multicast messages from servers.
Figure 16 Network diagram NTP configuration task list Task Remarks Configuring NTP operation modes Required. Configuring the local clock as a reference source Optional. Configuring optional parameters for NTP Optional. Configuring access-control rights Optional. Configuring NTP authentication Optional. Configuring NTP operation modes Devices can implement clock synchronization in one of the following modes: • Client/server mode—Configure only clients.
Configuring NTP client/server mode If you specify the source interface for NTP messages by specifying the source interface source-interface option, NTP uses the primary IP address of the specified interface as the source IP address of the NTP messages. A device can act as a server to synchronize other devices only after it is synchronized. If a server has a stratum level higher than or equal to a client, the client does not synchronize to that server.
Step 2. Specify a symmetric-passive peer for the device. Command Remarks ntp-service unicast-peer [ vpn-instance vpn-instance-name ] { ip-address | peer-name } [ authentication-keyid keyid | priority | source-interface interface-type interface-number | version number ] * By default, no symmetric-passive peer is specified. The ip-address argument must be a unicast address, rather than a broadcast address, a multicast address, or the IP address of the local clock.
Configure the NTP multicast mode on both the server and clients. The NTP multicast mode must be configured in a specific interface view. For more information about tunnel interfaces, see Layer 3—IP Services Configuration Guide. Configuring a multicast client Step Command Remarks 1. Enter system view. system-view N/A 2. Enter interface view. interface interface-type interface-number This command enters the view of the interface for sending NTP multicast messages. 3.
Step Configure the local clock as a reference source. 2. Command Remarks ntp-service refclock-master [ ip-address ] [ stratum ] The value of the ip-address argument must be 127.127.1.u, where u represents the NTP process ID in the range of 0 to 3. Configuring optional parameters for NTP This section explains how to configure the optional parameters for NTP.
Step Command Remarks 2. Enter interface view. interface interface-type interface-number N/A 3. Disable the interface from receiving NTP messages. ntp-service in-interface disable By default, an interface is enabled to receive NTP messages. Configuring the allowed maximum number of dynamic sessions Step Command Remarks 1. Enter system view. system-view N/A 2. Configure the maximum number of dynamic sessions allowed to be established locally.
Configuration procedure To configure the NTP service access-control right to the local device: Step Command Remarks 1. Enter system view. system-view N/A 2. Configure the NTP service access-control right for a peer device to access the local device. ntp-service access { peer | query | server | synchronization } acl-number The default is peer. The access-control right mechanism provides only a minimum degree of security protection for the system running NTP.
Step 3. 4. Command By default, no NTP authentication key is configured. Configure an NTP authentication key. ntp-service authentication-keyid keyid authentication-mode md5 [ cipher | simple ] value Configure the key as a trusted key. ntp-service reliable authentication-keyid keyid By default, no authentication key is configured to be trusted. ntp-service unicast-server { ip-address | server-name } authentication-keyid keyid You can associate a non-existing key with an NTP server.
Configuring NTP authentication for an active peer Step Command Remarks 1. Enter system view. system-view N/A 2. Enable NTP authentication. ntp-service authentication enable By default, NTP authentication is disabled. 3. Configure an NTP authentication key. ntp-service authentication-keyid keyid authentication-mode md5 [ cipher | simple ] value 4. Configure the key as a trusted key. ntp-service reliable authentication-keyid keyid By default, no authentication key is configured to be trusted.
Step Command Remarks By default, NTP authentication is disabled. 2. Enable NTP authentication. ntp-service authentication enable 3. Configure an NTP authentication key. ntp-service authentication-keyid keyid authentication-mode md5 [ cipher | simple ] value Configure the key as a trusted key. ntp-service reliable authentication-keyid keyid 4. By default, no NTP authentication key is configured. Configure the same authentication key on the client and server.
Step 3. 4. Command Configure an NTP authentication key. ntp-service authentication-keyid keyid authentication-mode md5 [ cipher | simple ] value Configure the key as a trusted key. ntp-service reliable authentication-keyid keyid Remarks By default, no NTP authentication key is configured. Configure the same authentication key on the client and server. By default, no authentication key is configured to be trusted. Configuring NTP authentication for a multicast server Step Command Remarks 1.
NTP configuration examples NTP client/server mode configuration example Network requirements Perform the following configurations to synchronize the time between Device B and Device A: • As shown in Figure 17, the local clock of Device A is to be used as a reference source, with the stratum level 2. • Device B operates in client/server mode and Device A is to be used as the NTP server of Device B. Figure 17 Network diagram Configuration procedure 1.
Clock precision: 2^7 Clock offset: 0.0000 ms Root delay: 31.00 ms Root dispersion: 1.05 ms Peer dispersion: 7.81 ms Reference time: 14:53:27.371 UTC Sep 19 2005 (C6D94F67.5EF9DB22) The output shows that Device B has synchronized to Device A. The stratum level of Device B is 3, and that of Device A is 2. # Display NTP session information for Device B, which shows that an association has been set up between Device B and Device A.
3. Configure Device B: # Specify Device A as the NTP server of Device B. system-view [DeviceB] ntp-service unicast-server 3.0.1.31 4. Configure Device C (after Device B is synchronized to Device A): # Specify the local clock as the reference source, with the stratum level 1. system-view [DeviceC] ntp-service refclock-master 1 # Configure Device B as a symmetric peer after local synchronization. [DeviceC] ntp-service unicast-peer 3.0.1.
Router B and Router A operate in broadcast client mode and receive broadcast messages through their respective Ethernet 1/1. • Figure 19 Network diagram Eth1/1 3.0.1.31/24 Router C Eth1/1 3.0.1.30/24 Router A Eth1/1 3.0.1.32/24 Router B Configuration procedure 1. Set the IP address for each interface as shown in Figure 19. (Details not shown.) 2. Configure Router C: # Specify the local clock as the reference source, with the stratum level 2.
Actual frequency: 64.0000 Hz Clock precision: 2^7 Clock offset: 0.0000 ms Root delay: 31.00 ms Root dispersion: 8.31 ms Peer dispersion: 34.30 ms Reference time: 16:01:51.713 UTC Sep 19 2005 (C6D95F6F.B6872B02) The output shows that Router A has synchronized to Router C. The stratum level of Router A is 3, and that of Router C is 2. # Display NTP session information for Router A, which shows that an association has been set up between Router A and Router C.
system-view [RouterC] ntp-service refclock-master 2 # Configure Router C to operate in multicast server mode and send multicast messages through Ethernet 1/1. [RouterC] interface ethernet 1/1 [RouterC-Ethernet1/1] ntp-service multicast-server 3. Configure Router D: # Configure Router D to operate in multicast client mode and receive multicast messages on Ethernet 1/1.
[RouterB-Ethernet1/1] quit [RouterB] interface ethernet 1/2 [RouterB-Ethernet1/2] pim dm 5. Configure Router A: system-view [RouterA] interface ethernet 1/1 # Configure Router A to operate in multicast client mode and receive multicast messages on Ethernet 1/1. [RouterA-Ethernet1/1] ntp-service multicast-client # Display the NTP status of Router A after clock synchronization. [RouterA-Ethernet1/1] display ntp-service status Clock status: synchronized Clock stratum: 3 Reference clock ID: 3.0.1.
Figure 21 Network diagram Configuration procedure 1. Set the IP address for each interface as shown in Figure 21. (Details not shown.) 2. Configure Device A: # Specify the local clock as the reference source, with the stratum level 2. system-view [DeviceA] ntp-service refclock-master 2 3. Configure Device B: system-view # Enable NTP authentication on Device B. [DeviceB] ntp-service authentication enable # Set an authentication key.
# Display NTP session information for Device B, which shows that an association has been set up Device B and Device A. [DeviceB] display ntp-service sessions source reference stra reach poll now offset delay disper ************************************************************************** [12345] 1.0.1.11 127.127.1.0 2 63 64 3 -75.5 31.0 16.
# Enable NTP authentication on Router B. Configure an NTP authentication key, with the key ID of 88 and key value of 123456. Specify the key as a trusted key. system-view [RouterB] ntp-service authentication enable [RouterB] ntp-service authentication-keyid 88 authentication-mode md5 123456 [RouterB] ntp-service reliable authentication-keyid 88 # Configure Router B to operate in broadcast client mode and receive NTP broadcast messages on Ethernet 1/1.
Clock status: unsynchronized Clock stratum: 16 Reference clock ID: none Nominal frequency: 100.0000 Hz Actual frequency: 100.0000 Hz Clock precision: 2^18 Clock offset: 0.0000 ms Root delay: 0.00 ms Root dispersion: 0.00 ms Peer dispersion: 0.00 ms Reference time: 00:00:00.000 UTC Jan 1 1900(00000000.00000000) # Enable NTP authentication on Router C. Configure an NTP authentication key, with the key ID of 88 and key value of 123456. Specify the key as a trusted key.
Clock stratum: 4 Reference clock ID: 3.0.1.31 Nominal frequency: 64.0000 Hz Actual frequency: 64.0000 Hz Clock precision: 2^7 Clock offset: 0.0000 ms Root delay: 31.00 ms Root dispersion: 8.31 ms Peer dispersion: 34.30 ms Reference time: 16:01:51.713 UTC Sep 19 2005 (C6D95F6F.B6872B02) Configuration example for MPLS VPN time synchronization in client/server mode Network requirements As shown in Figure 23, two VPNs are present on PE 1 and PE 2: VPN 1 and VPN 2. CE 1 and CE 3 are devices in VPN 1.
Configuration procedure Before you perform the following configuration, be sure you have completed MPLS VPN-related configurations and make sure of the reachability between CE 1 and PE 1, between PE 1 and PE 2, and between PE 2 and CE 3. For information about configuring MPLS VPN, see MPLS Configuration Guide. 1. Set the IP address for each interface as shown in Figure 23. (Details not shown.) 2. Configure CE 1: # Specify the local clock as the reference source, with the stratum level 1.
Configuration procedure 1. Set the IP address for each interface as shown in Figure 23. (Details not shown.) 2. Configure CE 1: # Specify the local clock as the reference source, with the stratum level 1. system-view [CE1] ntp-service refclock-master 1 3. Configure PE 1: # Specify CE 1 as the symmetric-passive peer for VPN 1. system-view [PE1] ntp-service unicast-peer vpn-instance vpn1 10.1.1.
Configuring cluster management Overview Cluster management is an effective way to manage large numbers of dispersed network devices in groups and offers the following advantages: • Saves public IP address resources. You do not need to assign one public IP address for every cluster member device. • Simplifies configuration and management tasks. By configuring a public IP address on one device, you can configure and manage a group of devices without having to log in to them one by one.
As shown in Figure 24, the device configured with a public IP address and performing the management function is the management device, the other managed devices are member devices, and the device that does not belong to any cluster but can be added to a cluster is a candidate device. The management device and the member devices form the cluster.
NDP runs on the data link layer and supports different network layer protocols. About NTDP NTDP provides information required for cluster management. It collects topology information about the devices within the specified hop count.
Figure 26 Management/member device state change A cluster manages the state of its member devices as follows: • After a candidate device is added to the cluster and becomes a member device, the management device saves its state information and identifies it as Active. The member device also saves its state information and identifies itself as Active. • The management device and member devices send handshake packets.
To ensure security of the cluster management VLAN, PCs and other network devices that do not belong to the cluster are not allowed to join the management VLAN, only ports on devices of the cluster can join the management VLAN. IMPORTANT: To guarantee the communication within the cluster, ensure VLAN handling consistency on all ports on the path from a member device or candidate device to the management device.
Task Remarks • Configuring communication between the management device and the member devices within a cluster Optional. • Configuring cluster management protocol packets Optional. • Cluster member management Optional. Configuring the member devices: • Enabling NDP Required. • Enabling NTDP Required. • Manually collecting topology information Optional. • Enabling the cluster function Required. • Deleting a member device from a cluster Optional.
Configuring NDP parameters An NDP-enabled port periodically sends NDP packets that have an aging time. If the receiving device has not received any NDP packet before that aging time expires, the receiving device automatically removes the neighbor entry for the sending device. To avoid NDP table entry flappings, make sure the NDP aging timer is equal to or longer than the NDP packet sending interval. To configure NDP parameters: Step Command Remarks N/A 1. Enter system view. system-view 2.
{ { Forwarding delay for the first NTDP-enabled port—After receiving a topology request, the requested device forwards the request out of the first NTDP-enabled port when this forwarding delay expires rather than immediately. Forwarding delay for other NTDP-enabled ports—After the first NTDP-enabled port forwards the request, all other NTDP-enabled ports forward the request in turn at this delay interval. The delay settings are conveyed in topology requests sent to the requested devices.
Establishing a cluster To successfully establish a cluster: • Make sure UDP port 40000 is not used by any application. This port will be used by the cluster management module for exchanging handshake packets. • Perform the following tasks before establishing the cluster: { { Specify a management VLAN. You cannot change the management VLAN after a cluster is created. Configure a private IP address pool on the management device for cluster member devices.
To enable management VLAN autonegotiation on the management device: Step Command Remarks 1. Enter system view. system-view N/A 2. Enter cluster view. cluster N/A 3. Enable management VLAN auto-negotiation. management-vlan synchronization enable By default, this function is disabled.
• If the interval for sending MAC address negotiation broadcast packets is 0, the system automatically sets it to 1 minute. • If the interval for sending MAC address negotiation broadcast packets is not 0, the interval remains unchanged. To configure the destination MAC address of the cluster management protocol packets: Step Command Remarks 1. Enter system view. system-view N/A 2. Enter cluster view. cluster N/A 3.
Configuring the member devices Enabling NDP See "Enabling NDP globally and for specific ports." Enabling NTDP See "Enabling NTDP globally and for specific ports." Manually collecting topology information See "Manually collecting topology information." Enabling the cluster function See "Enabling the cluster function." Deleting a member device from a cluster Step Command 1. Enter system view. system-view 2. Enter cluster view. cluster 3. Delete a member device from the cluster.
Task Command Remarks Access the CLI of a member device from the management device. cluster switch-to { member-number | mac-address mac-address | sysname member-sysname } N/A cluster switch-to administrator You can use this command only if you are not logged in to the member device from the CLI of the management device. Access the CLI of the management device from a member device. Adding a candidate device to a cluster Step Command 1. Enter system view. system-view 2. Enter cluster view.
Step Command Remarks 1. Enter system view. system-view N/A 2. Enter cluster view. cluster N/A 3. Add a device to the blacklist. black-list add-mac mac-address Optional. 4. Remove a device from the blacklist. black-list delete-mac { all | mac-address } Optional. 5. Confirm the current topology and save it as the standard topology. topology accept { all [ save-to { ftp-server | local-flash } ] | mac-address mac-address | member-id member-number } Optional. 6.
Step Command Remarks 6. Configure the SNMP NM host shared by the cluster. snmp-host ip-address [ community-string read string1 write string2 ] By default, no SNMP host is configured. 7. Configure the NM interface of the management device. nm-interface vlan-interface interface-name Optional.
devices) in a cluster through Web. These Web user account settings are retained on the member devices after they are removed from the whitelist or the cluster is dismissed. To configure Web user accounts in batches: Step Command 1. Enter system view. system-view 2. Enter cluster view. cluster 3. Configure Web user accounts in batches.
Task Command Remarks Display information about cluster members. display cluster members [ member-number | verbose ] [ | { begin | exclude | include } regular-expression ] Available in any view. Clear NDP statistics. reset ndp statistics [ interface interface-list ] Available in user view. Cluster management configuration example Network requirements • Three devices form cluster abc, whose management VLAN is VLAN 10.
[DeviceA-Ethernet1/1] ntdp enable [DeviceA-Ethernet1/1] quit # Enable the cluster function. [DeviceA] cluster enable 2. Configure the member device Device C: As the configurations of the member devices are the same, the configuration procedure of Device C is not shown. 3. Configure the management device Device B: # Enable NDP globally and for ports Ethernet 1/2 and Ethernet 1/3.
[DeviceB-Ethernet1/2] port trunk permit vlan 10 [DeviceB-Ethernet1/2] quit [DeviceB] interface ethernet 1/3 [DeviceB-Ethernet1/3] port link-type trunk [DeviceB-Ethernet1/3] port trunk permit vlan 10 [DeviceB-Ethernet1/3] quit # Enable the cluster function. [DeviceB] cluster enable # Configure a private IP address range for the member devices, which is from 172.16.0.1 to 172.16.0.7. [DeviceB] cluster [DeviceB-cluster] ip-pool 172.16.0.1 255.255.255.
Configuring CWMP (TR-069) Overview CPE WAN Management Protocol (CWMP), also called "TR-069," is a DSL Forum technical specification for remote management of home network devices. It defines the general framework, message format, management method, and data model for managing and configuring home network devices. CWMP applies mainly to DSL access networks, which are hard to manage because end-user devices are dispersed and large in number.
• A CPE is configured to send Inform messages periodically. The CPE automatically sends an Inform message at the configured interval to establish connections. • A CPE is configured to send an Inform message at a specific time. The CPE automatically sends an Inform message at the configured time to establish a connection. • The current session is interrupted incorrectly. In this case, if the number of CPE autoconnection retries does not reach the limit, the CPE automatically establishes a connection.
• ManufacturerOUI • SerialNumber • HardwareVersion • SoftwareVersion • DeviceStatus • UpTime • Configuration file (ConfigFile) • ACS address (URL) • ACS username (Username) • ACS password (Password) • PeriodicInformEnable • PeriodicInformInterval • PeriodicInformTime • CPE address (ConnectionRequestURL) • • CPE username (ConnectionRequestUsername) CPE password (ConnectionRequestPassword) CWMP mechanism RPC methods CWMP provides the following major remote procedure call methods
Figure 29 Example of the CWMP message interaction The following steps show how CWMP works: 1. Establish a TCP connection. 2. Initialize SSL and establish a security connection. 3. The CPE sends an Inform request message to initiate a CWMP connection. The Inform message carries the reason for sending this message in the Eventcode field. In this example, the reason is "6 CONNECTION REQUEST," indicating that the ACS requires the CPE to establish a connection. 4.
your network. Support for these configuration modes varies with attributes. For more information, see "Configuring CWMP at the CLI." Configuring ACS and CPE attributes through ACS An ACS performs autoconfiguration of a CPE through remote management. For the primary configurable parameters, see "Autoconfiguration." Configuring ACS and CPE attributes through DHCP You can configure ACS parameters for the CPE on the DHCP server by using DHCP Option 43.
Task Remarks Enabling CWMP Required. Configuring ACS attributes: Required. • Configuring the ACS URL Supports configuration through ACS, DHCP, and CLI. Optional. • Configuring the ACS username and password Supports configuration through ACS, DHCP, and CLI. Configuring CPE attributes: Optional. • Configuring the CPE username and password • Configuring the CWMP connection interface Supports configuration through ACS and CLI. Optional. Supports configuration through CLI only. Optional.
the request, if the parameter values in the request are consistent with those configured locally, the authentication succeeds, and the connection is allowed to be established. If not, the authentication fails, and the connection is not allowed to be established. Configuring the ACS URL You can assign only one ACS for a CPE and the ACS URL you configured overwrites the old one, if any. To configure the ACS URL: Step Command Remarks 1. Enter system view. system-view N/A 2. Enter CWMP view.
Configuring the CPE username and password Step Command Remarks 1. Enter system view. system-view N/A 2. Enter CWMP view. cwmp N/A 3. Configure the CPE username for connection to the CPE. cwmp cpe username username By default, no CPE username is configured for connection to the CPE. Optional. 4. Configure the CPE password for connection to the CPE.
Step Command Remarks 1. Enter system view. system-view N/A 2. Enter CWMP view. cwmp N/A 3. Enable the periodic sending of Inform messages. cwmp cpe inform interval enable By default, this function is disabled. 4. Configure the interval between sending the Inform messages. cwmp cpe inform interval seconds Optional. By default, the CPE sends an Inform message every 600 seconds. To configure the CPE to send an Inform message at a specific time: Step Command Remarks 1. Enter system view.
To configure the close-wait timer for the CPE: Step Command Remarks 1. Enter system view. system-view N/A 2. Enter CWMP view. cwmp N/A 3. Set the CPE close-wait timer. cwmp cpe wait timeout seconds Optional. The default setting is 30 seconds. Configuring the CPE working mode Configure the device to operate in one of the following CPE modes depending on its position in the network: • Gateway mode—Enables the ACS to manage the device and any CPE attached to the device.
Displaying and maintaining CWMP Task Command Remarks Display CWMP configuration. display cwmp configuration [ | { begin | exclude | include } regular-expression ] Available in any view. Display the current status of CWMP. display cwmp status [ | { begin | exclude | include } regular-expression ] Available in any view.
Configuring IP accounting IP accounting collects IP packet statistics on the device. It uses IP accounting rules to classify packets and uses flow entries to store packet statistics in different tables. Each IP accounting rule specifies a subnet to match packets sourced from and destined to the subnet. Each flow entry records the source and destination IP addresses, protocol number, packet sum, and byte sum for a flow. If a flow entry is not updated within the timeout time, IP accounting deletes it.
Step Command Remarks • Enable IP accounting for valid incoming IP packets on the current interface: ip count inbound-packets • Enable IP accounting for valid outgoing IP packets on the current interface: ip count outbound-packets 8. Configure the type of packet accounting. • Enable IP accounting for firewall-denied incoming packets on the current interface: ip count firewall-denied inbound-packets Select at least one type of packet accounting.
Figure 30 Network diagram Configuration procedure The two hosts can be replaced by other types of network devices such as routers. 1. Configure the router: # Enable IP accounting. system-view [Router] ip count enable # Configure an IP accounting rule. [Router] ip count rule 1.1.1.1 24 # Set the timeout time to 1440 minutes (24 hours). [Router] ip count timeout 1440 # Set the maximum number of flow entries in the interior table to 100.
Configuring NetStream Overview Conventional ways to collect traffic statistics, like SNMP and port mirroring, cannot provide precise network management because of inflexible statistical methods or the high cost of required dedicated servers. This calls for a new technology to collect traffic statistics. NetStream provides statistics about network traffic flows, and it can be deployed on access, distribution, and core layers.
• NetStream collector (NSC)—The NSC is usually a program running in UNIX or Windows. It parses the packets sent from the NDE, and then it stores the statistics to the database for the NDA. The NSC gathers the data from multiple NDEs, and then it filters and aggregates the total received data. • NetStream data analyzer (NDA)—The NDA is a tool for analyzing network traffic.
NetStream aggregation data export NetStream aggregation merges the flow statistics according to the aggregation criteria of an aggregation mode, and it sends the summarized data to the NetStream server. This process is the NetStream aggregation data export, which uses less bandwidth than traditional data export. For example, the aggregation mode configured on the NDE is protocol-port, which means that is aggregates statistics about flow entries by protocol number, source port, and destination port.
Aggregation mode Aggregation criteria Source prefix Prefix-port aggregation • • • • • • • • • • • • • • • ToS • • • • • ToS • • • • • ToS • • • • • • • • • ToS • • • • • • ToS ToS-AS aggregation ToS-source-prefix aggregation ToS-destination-prefix aggregation ToS- prefix aggregation ToS-protocol-port aggregation ToS-BGP-nexthop Destination prefix Source address mask length Destination address mask length ToS Protocol number Source port Destination port Inbound interface index Outbound int
In an aggregation mode with AS, if the packets are not forwarded according to the BGP routing table, the statistics on the AS number cannot be obtained. In the aggregation mode of ToS-BGP-nexthop, if the packets are not forwarded according to the BGP routing table, the statistics on the BGP next hop cannot be obtained. NetStream export formats NetStream exports data in UDP datagrams in one of the following formats: • Version 5—Exports original statistics collected based on the 7-tuple elements.
Figure 32 NetStream configuration flow Start Enable NetStream Configure filtering Yes Filter? No Yes Configure sampling Sample? No Configure export format Configure flow aging Configure aggregation data export Yes Aggregate? No Configure common data export End Complete these tasks to configure NetStream: Task Remarks Enabling NetStream on an interface Required. Configuring NetStream filtering and sampling Optional. Configuring NetStream sampling Optional.
Step Enable NetStream on the interface. 3. Command Remarks ip netstream { inbound | outbound } Disabled by default. Configuring NetStream filtering and sampling Before you configure NetStream filtering and sampling, use the ip netstream command to enable NetStream. Configuring NetStream filtering When you configure NetStream filtering, follow these guidelines: • The NetStream filtering function is not effective on MPLS packets.
Configuring NetStream data export To allow the NDE to export collected statistics to the NetStream server, configure the source interface out of which the data is sent and the destination address to which the data is sent. Configuring NetStream traditional data export Step Command Remarks 1. Enter system view. system-view N/A 2. Enter interface view. interface interface-type interface-number N/A 3. Enable NetStream. ip netstream { inbound | outbound } Disabled by default. 4.
Step Command Remarks 2. Enter interface view. interface interface-type interface-number N/A 3. Enable NetStream. ip netstream { inbound | outbound } Disabled by default. 4. Exit to system view. quit N/A Set a NetStream aggregation mode and enter its view. ip netstream aggregation { as | destination-prefix | prefix | prefix-port | protocol-port | source-prefix | tos-as | tos-destination-prefix | tos-prefix | tos-protocol-port | tos-source-prefix | tos-bgp-nexthop } N/A 5. 6.
Step 1. Enter system view. Command Remarks system-view N/A Optional. By default: 2. Configure the version for NetStream export format, and specify whether to record AS and BGP next hop information. • ip netstream export version 5 [ origin-as | peer-as ] • ip netstream export version 9 [ origin-as | peer-as ] [ bgp-nexthop ] • NetStream traditional data export uses version 5. • IPv4 NetStream aggregation data export uses version 8. • MPLS flow data is not exported.
Configuring the refresh rate for NetStream version 9 templates Version 9 is template-based and supports user-defined formats, so the NetStream-enabled device needs to resend a new template to the NetStream server for an update. If the version 9 format is changed on the NetStream-enabled device and is not updated on the NetStream server, the server cannot associate the received statistics with its proper fields.
• Forced aging • TCP FIN- and RST-triggered aging (automatically triggered if a TCP connection is terminated) Periodical aging Periodical aging uses the following approaches: • Inactive flow aging—A flow is considered inactive if its statistics have not been changed, which means no packet for this NetStream entry arrives in the time specified by the ip netstream timeout inactive command. The inactive flow entry remains in the cache until the inactive timer expires.
Step 3. Command Configure forced aging of the NetStream entries. Remarks a. Set the maximum entries that the cache can accommodate: ip netstream max-entry max-entries b. Exit to user view: quit c. Configure forced aging: reset ip netstream statistics Optional. By default, the cache can accommodate a maximum of 100 entries. The reset ip netstream statistics command also clears the cache. Displaying and maintaining NetStream Task Command Remarks Display NetStream entry information in the cache.
Configuration procedure # Enable NetStream for incoming traffic on Ethernet 1/0. system-view [RouterA] interface ethernet 1/0 [RouterA-Ethernet1/0] ip address 11.110.2.1 255.255.0.0 [RouterA-Ethernet1/0] ip netstream inbound [RouterA-Ethernet1/0] quit # Enable NetStream for outgoing traffic on Ethernet1/1. [RouterA] interface ethernet 1/1 [RouterA-Ethernet1/1] ip address 12.110.2.1 255.255.0.
[RouterA-Ethernet1/0] ip address 3.1.1.1 255.255.0.0 [RouterA-Ethernet1/0] ip netstream inbound [RouterA-Ethernet1/0] ip netstream outbound [RouterA-Ethernet1/0] quit # In system view, configure the destination address and the destination UDP port number for the NetStream traditional data export with IP address 4.1.1.1 and port 5000. [RouterA] ip netstream export host 4.1.1.
Configuring NQA Overview Network quality analyzer (NQA) allows you to monitor link status, measure network performance, verify the service levels for IP services and applications, and troubleshoot network problems.
Figure 37 Collaboration Application modules Detection module VRRP Associates with a detection entry NQA Track module Sends the detection result Associates with a track entry Sends the track entry status Static routing Policy-based routing Interface backup Traffic redirection WLAN uplink detection The following describes how a static route destined for 192.168.0.88 is monitored through collaboration: 1. NQA monitors the reachability to 192.168.0.88. 2. When 192.168.0.
NQA configuration task list Complete the following task to configure the NQA server: Task Remarks Configuring the NQA server Required for NQA operations types of TCP, UDP echo, UDP jitter, and voice. Complete these tasks to configure the NQA client: Task Remarks Enabling the NQA client Required. Configuring an ICMP echo operation Configuring a DHCP operation Configuring a DNS operation Configuring an FTP operation Configuring an HTTP operation Required.
Step Command Remarks 1. Enter system view. system-view N/A 2. Enable the NQA server. nqa server enable Disabled by default. • Method 1: 3. Configure a listening service. nqa server tcp-connect ip-address port-number • Method 2: Use at least one method. nqa server udp-echo ip-address port-number Configuring the NQA client Enabling the NQA client Step Command Remarks N/A 1. Enter system view. system-view 2. Enable the NQA client. nqa agent enable Optional. Enabled by default.
Step 6. 7. Command Remarks Optional. Configure the string to be filled in the payload of each ICMP echo request. data-fill string Specify the VPN where the operation is performed. vpn-instance vpn-instance-name By default, the string is the hexadecimal number 00010203040506070809. Optional. By default, the operation is performed on the public network. Optional. • Method 1: 8. Specify the source interface and the source IP address of ICMP echo requests.
Step Command Specify an interface to perform the DHCP operation. 4. operation interface interface-type interface-number Remarks By default, no interface is specified to perform a DHCP operation. The specified interface must be up. Otherwise, no probe packets can be sent out. Configuring a DNS operation A DNS operation measures the time the NQA client uses to translate a domain name into an IP address through a DNS server.
Step Command Remarks 1. Enter system view. system-view N/A 2. Create an NQA operation and enter NQA operation view. nqa entry admin-name operation-tag By default, no NQA operation is created. 3. Specify the FTP type and enter its view. type ftp N/A 4. Specify the IP address of the FTP server as the destination address of FTP request packets. destination ip ip-address By default, no destination IP address is configured. By default, no source IP address is specified. 5.
Step Command Remarks 3. Specify the HTTP type and enter its view. type http N/A 4. Configure the IP address of the HTTP server as the destination address of HTTP request packets. destination ip ip-address By default, no destination IP address is configured. Optional. Configure the source IP address of request packets. 5. By default, no source IP address is specified. source ip ip-address The source IP address must be the IP address of a local interface. The local interface must be up.
Step Command Remarks 2. Create an NQA operation and enter NQA operation view. nqa entry admin-name operation-tag By default, no NQA operation is created. 3. Specify the UDP jitter type and enter its view. type udp-jitter N/A 4. Configure the destination address of UDP packets. By default, no destination IP address is configured. destination ip ip-address By default, no destination port number is configured. 5. Configure the destination port of UDP packets. 6.
NOTE: The display nqa history command does not show the results of the UDP jitter operation. Use the display nqa result command to display the results, or use the display nqa statistics command to display the statistics of the operation. Configuring an SNMP operation An SNMP operation measures the time the NQA client uses to get a value from an SNMP agent. To configure an SNMP operation: Step Command Remarks 1. Enter system view. system-view N/A 2.
Step 3. Specify the TCP type and enter its view. Command Remarks type tcp N/A By default, no destination IP address is configured. 4. 5. Configure the destination address of TCP packets. Configure the destination port of TCP packets. destination ip ip-address The destination address must be the same as the IP address of the listening service configured on the NQA server. By default, no destination port number is configured.
Step Command By default, no destination port number is configured. 5. Configure the destination port of UDP packets. destination port port-number 6. Configure Payload size in each UDP packet. data-size size 7. 8. Remarks The destination port number must be the same as that of the listening service on the NQA server. Optional. 100 bytes by default. Optional. Configure the string to be filled in the payload of each UDP packet. data-fill string Specify the source port of UDP packets.
The evaluation of voice quality depends on users' tolerance for voice quality, which you should consider. For users with higher tolerance for voice quality, use the advantage-factor command to configure the advantage factor. When the system calculates the ICPIF value, it subtracts the advantage factor to modify ICPIF and MOS values, so both objective and subjective factors are considered. The voice operation requires both the NQA server and the NQA client.
Step Command Remarks Optional. 10. Configure Payload size in each voice packet. data-size size By default, the voice packet size depends on the codec type. The default packet size is 172 bytes for G.711A-law and G.711 μ-law codec type, and 32 bytes for G.729 A-law codec type. Optional. 11. Configure the string to be filled in the payload of each voice packet. data-fill string By default, the string is the hexadecimal number 00010203040506070809. 12.
Step Command Remarks Optional. 5. Configure the source IP address of probe packets. By default, no source IP address is specified. source ip ip-address The source IP address must be the IP address of a local interface. The local interface must be up. Otherwise, no probe packets can be sent out. Configuring optional parameters for an NQA operation Unless otherwise specified, the following optional parameters apply to all NQA operation types.
Step Command Remarks Optional. Specify the TTL for probe packets. 8. Specify the ToS value in the IP packet header of probe packets. 9. 20 by default. ttl value This setting is not available for the DHCP operation. Optional. 0 by default. tos value This setting is not available for the DHCP operation. Optional. 10. Enable the routing table bypass function. route-option bypass-route Disabled by default. This setting is not available for the DHCP operation.
An NQA operation supports the following threshold types: { { { average—If the average value for the monitored performance metric either exceeds the upper threshold or goes below the lower threshold, a threshold violation occurs. accumulate—If the total number of times that the monitored performance metric is out of the specified value range reaches or exceeds the specified threshold, a threshold violation occurs.
Step 3. Specify an NQA operation type and enter its view.
Configuring the NQA statistics function NQA collects statistics for an operation in a statistics group. To view information about the statistics groups, use the display nqa statistics command. To set the interval for collecting statistics, use the statistics interval command. If a new statistics group is to be saved when the number of statistics groups reaches the upper limit, the oldest statistics group is deleted.
If the maxim number is reached, the earliest history records are removed. To configure the history records saving function: Step Command Remarks 1. Enter system view. system-view N/A 2. Create an NQA operation and enter NQA operation view. nqa entry admin-name operation-tag By default, no NQA operation is created. 3. Enter NQA operation type view. type { dhcp | dlsw | dns | ftp | http | icmp-echo | snmp | tcp | udp-echo | udp-jitter | voice } N/A 4.
All MSR routers support the nqa agent max-concurrent command, but they have different value ranges and default values: Hardware Value range and default value Value range: 1 to 50 MSR900 Default: 5 Value range: 1 to 50 MSR93X Default: 5 Value range: 1 to 50 MSR20-1X Default: 5 Value range: 1 to 50 MSR20 Default: 5 Value range: 1 to 200 MSR30 Default: 20 Value range: 1 to 500 MSR50 Default: 80 Value range: 1 to 50 MSR1000 Default: 5 Displaying and maintaining NQA Task Command Remarks Displa
NQA configuration examples ICMP echo operation configuration example Network requirements As shown in Figure 38, configure and schedule an ICMP echo operation from the NQA client Device A to Device B through Device C to test the round-trip time. Figure 38 Network diagram Device C 10.1.1.2/24 10.2.2.1/24 NQA client 10.1.1.1/24 10.2.2.2/24 10.3.1.1/24 10.4.1.2/24 Device A Device B 10.4.1.1/24 10.3.1.2/24 Device D Configuration procedure # Assign each interface an IP address. (Details not shown.
# Enable saving history records and configure the maximum number of history records that can be saved as 10. [DeviceA-nqa-admin-test1-icmp-echo] history-record enable [DeviceA-nqa-admin-test1-icmp-echo] history-record number 10 [DeviceA-nqa-admin-test1-icmp-echo] quit # Start the ICMP echo operation. [DeviceA] nqa schedule admin test1 start-time now lifetime forever # Stop the ICMP echo operation after a period of time.
DHCP operation configuration example Network requirements As shown in Figure 39, configure and schedule a DHCP operation to test the time required for Router A to obtain an IP address from the DHCP server (Router B). Figure 39 Network diagram Configuration procedure # Create a DHCP operation to be performed on interface Ethernet 1/1.
1 512 Succeeded 2011-11-22 09:54:03.8 The output shows that Router A uses 512 milliseconds to obtain an IP address from the DHCP server. DNS operation configuration example Network requirements As shown in Figure 40, configure a DNS operation to test whether Device A can translate the domain name host.com into an IP address through the DNS server, and test the time required for resolution. Figure 40 Network diagram Configuration procedure # Assign each interface an IP address. (Details not shown.
Failures due to timeout: 0 Failures due to disconnect: 0 Failures due to no connection: 0 Failures due to sequence error: 0 Failures due to internal error: 0 Failures due to other errors: 0 Packet(s) arrived late: 0 # Display the history records of the DNS operation. [DeviceA] display nqa history admin test1 NQA entry (admin admin, tag test1) history record(s): Index Response Status Time 1 62 Succeeded 2008-11-10 10:49:37.
[DeviceA-nqa-admin-test1-ftp] filename config.txt # Enable the saving of history records. [DeviceA-nqa-admin-test1-ftp] history-record enable [DeviceA-nqa-admin-test1-ftp] quit # Start the FTP operation. [DeviceA] nqa schedule admin test1 start-time now lifetime forever # Stop the FTP operation after a period of time. [DeviceA] undo nqa schedule admin test1 # Display the results of the FTP operation.
# Configure static routes or a routing protocol to make sure the devices can reach each other. (Details not shown.) # Create an HTTP operation. system-view [DeviceA] nqa entry admin test1 [DeviceA-nqa-admin-test1] type http # Specify the IP address of the HTTP server 10.2.2.2 as the destination IP address. [DeviceA-nqa-admin-test1-http] destination ip 10.2.2.2 # Configure the HTTP operation to get data from the HTTP server. By default, the HTTP operation type is get.
The output shows that Device A uses 64 milliseconds to obtain data from the HTTP server. UDP jitter operation configuration example Network requirements As shown in Figure 43, configure a UDP jitter operation to test the jitter, delay, and round-trip time between Device A and Device B. Figure 43 Network diagram Configuration procedure 1. Assign each interface an IP address. (Details not shown.) 2. Configure static routes or a routing protocol to make sure the devices can reach each other.
Square-Sum of round trip time: 3235 Last succeeded probe time: 2008-05-29 13:56:17.
Failures due to sequence error: 0 Failures due to internal error: 0 Failures due to other errors: 0 Packet(s) arrived late: 0 UDP-jitter results: RTT number: 410 Min positive SD: 3 Min positive DS: 1 Max positive SD: 30 Max positive DS: 79 Positive SD number: 186 Positive DS number: 158 Positive SD sum: 2602 Positive DS sum: 1928 Positive SD average: 13 Positive DS average: 12 Positive SD square sum: 45304 Positive DS square sum: 31682 Min negative SD: 1 Min negative DS: 1 Max negative SD: 30
# Set the read community to public. [DeviceB] snmp-agent community read public # Set the write community to private. [DeviceB] snmp-agent community write private 4. Configure Device A: # Create an SNMP operation, and configure 10.2.2.2 as the destination IP address. system-view [DeviceA] nqa entry admin test1 [DeviceA-nqa-admin-test1] type snmp [DeviceA-nqa-admin-test1-snmp] destination ip 10.2.2.2 # Enable the saving of history records.
Figure 45 Network diagram Configuration procedure 1. Assign each interface an IP address. (Details not shown.) 2. Configure static routes or a routing protocol to make sure the devices can reach each other. (Details not shown.) 3. Configure Device B: # Enable the NQA server. system-view [DeviceB] nqa server enable # Configure a listening service to listen on the IP address 10.2.2.2 and TCP port 9000. [DeviceB] nqa server tcp-connect 10.2.2.2 9000 4.
Failures due to internal error: 0 Failures due to other errors: 0 Packet(s) arrived late: 0 # Display the history records of the TCP operation. [DeviceA] display nqa history admin test1 NQA entry (admin admin, tag test1) history record(s): Index 1 Response Status 13 Time Succeeded 2011-11-22 10:27:25.1 The output shows that Device A uses 13 milliseconds to establish a TCP connection to port 9000 on the NQA server.
[DeviceA] nqa schedule admin test1 start-time now lifetime forever # Stop the UDP echo operation after a period of time. [DeviceA] undo nqa schedule admin test1 # Display the results of the UDP echo operation. [DeviceA] display nqa result admin test1 NQA entry (admin admin, tag test1) test results: Destination IP address: 10.2.2.2 Send operation times: 1 Receive response times: 1 Min/Max/Average round trip time: 25/25/25 Square-Sum of round trip time: 625 Last succeeded probe time: 2011-11-22 10:36:17.
[DeviceB] nqa server enable # Configure a listening service to listen on IP address 10.2.2.2 and UDP port 9000. [DeviceB] nqa server udp-echo 10.2.2.2 9000 4. Configure Device A: # Create a voice operation. system-view [DeviceA] nqa entry admin test1 [DeviceA-nqa-admin-test1] type voice # Configure 10.2.2.2 as the destination IP address and port 9000 as the destination port. [DeviceA-nqa-admin-test1-voice] destination ip 10.2.2.
One way results: Max SD delay: 343 Max DS delay: 985 Min SD delay: 343 Min DS delay: 985 Number of SD delay: 1 Number of DS delay: 1 Sum of SD delay: 343 Sum of DS delay: 985 Square sum of SD delay: 117649 Square sum of DS delay: 970225 SD lost packet(s): 0 DS lost packet(s): 0 Lost packet(s) for unknown reason: 0 Voice scores: MOS value: 4.38 ICPIF value: 0 # Display the statistics of the voice operation.
Square sum of SD delay: 483202 Square sum of DS delay: 973651 SD lost packet(s): 0 DS lost packet(s): 0 Lost packet(s) for unknown reason: 0 Voice scores: Max MOS value: 4.38 Min MOS value: 4.38 Max ICPIF value: 0 Min ICPIF value: 0 DLSw operation configuration example Network requirements As shown in Figure 48, configure a DLSw operation to test the response time of the DLSw device. Figure 48 Network diagram Configuration procedure # Assign each interface an IP address. (Details not shown.
Failures due to no connection: 0 Failures due to sequence error: 0 Failures due to internal error: 0 Failures due to other errors: 0 Packet(s) arrived late: 0 # Display the history records of the DLSw operation. [DeviceA] display nqa history admin test1 NQA entry (admin admin, tag test1) history record(s): Index Response Status Time 1 19 Succeeded 2011-11-22 10:40:27.7 The output shows that the response time of the DLSw device is 19 milliseconds.
[RouterA-nqa-admin-test1-icmp-echo] reaction 1 checked-element probe-fail threshold-type consecutive 5 action-type trigger-only [RouterA-nqa-admin-test1-icmp-echo] quit # Start the ICMP echo operation. [RouterA] nqa schedule admin test1 start-time now lifetime forever 4. On Router A, create track entry 1, and associate it with reaction entry 1 of the ICMP echo operation.
Destinations : 4 Destination/Mask Proto 10.2.1.0/24 10.2.1.2/32 Routes : 4 Pre Cost NextHop Interface Direct 0 0 10.2.1.2 Eth1/1 Direct 0 0 127.0.0.1 InLoop0 127.0.0.0/8 Direct 0 0 127.0.0.1 InLoop0 127.0.0.1/32 Direct 0 0 127.0.0.1 InLoop0 The output shows that the static route does not exist, and the status of the track entry is Negative.
Configuring IP traffic ordering IP traffic ordering enables a device to collect and rank statistics for IP flows. An interface can be specified as an external or internal interface to collect traffic statistics: • External interface—Collects only inbound traffic statistics (classified by source IP addresses).
Figure 50 Network diagram Configuration procedure 1. Configure IP traffic ordering: # Enable IP traffic ordering on Ethernet 1/1 and specify the interface as an internal interface to collect statistics. system-view [Device] interface ethernet 1/1 [Device-Ethernet1/1] ip address 192.168.1.4 24 # Set the statistics interval to 30 seconds. [Device-Ethernet1/1] quit [Device] ip flow-ordering stat-interval 30 2. Display IP traffic ordering statistics.
Configuring sFlow Sampled Flow (sFlow) is a traffic monitoring technology used to collect and analyze traffic statistics. As shown in Figure 51, the sFlow system involves an sFlow agent embedded in a device and a remote sFlow collector. The sFlow agent collects interface counter information and packet content information and encapsulates the sampled information in sFlow packets.
Step 2. Command Configure an IP address for the sFlow agent. Remarks sflow agent { ip ip-address | ipv6 ipv6-address } Not specified by default. The device periodically checks whether the sFlow agent has an IP address. If the sFlow agent has no IP address configured, the device automatically selects an interface IP address for the sFlow agent but does not save the IP address. NOTE: • HP recommends that you configure an IP address manually for the sFlow agent.
Configuring counter sampling Step Command Remarks 1. Enter system view. system-view N/A 2. Enter interface view. interface interface-type interface-number N/A 3. Set the interval for counter sampling. sflow counter interval seconds Counter sampling is disabled by default. 4. Specify the sFlow collector for counter sampling. sflow counter collector collector-id No collector is specified for counter sampling by default.
# Configure parameters for an sFlow collector: specify sFlow collector ID 2, IP address 3.3.3.2, the default port number, and description of netserver for the sFlow collector. [Device] sflow collector 2 ip 3.3.3.2 description netserver 2. Configure counter sampling: # Set the counter sampling interval to 120 seconds. [Device] interface ethernet 1/1 [Device-Ethernet1/1] sflow counter interval 120 # Specify sFlow collector 2 for counter sampling. [Device-Ethernet1/1] sflow counter collector 2 3.
Analysis • The sFlow collector is not specified. • sFlow is not configured on the interface. • The IP address of the sFlow collector specified on the sFlow agent is different from that of the remote sFlow collector. • No IP address is configured for the Layer 3 interface on the device. Or the IP address is configured, but the UDP packets that have the IP address as the source cannot reach the sFlow collector. • The physical link between the device and the sFlow collector fails. 1.
Configuring samplers Overview A sampler samples packets. The sampler selects a packet from among sequential packets, and it sends the packet to the service module for processing. The following sampling modes are available: • Fixed mode—The first packet is selected from among sequential packets in each sampling. • Random mode—Any packet might be selected from among sequential packets in each sampling. A sampler can be used to sample packets for NetStream.
Sampler configuration example Network requirements As shown in Figure 53, configure IPv4 NetStream on Device to collect statistics on incoming and outgoing traffic on Ethernet 1/2. The NetStream data is sent to port 5000 on the NSC at 12.110.2.2/16. Do the following: • Configure fixed sampling in the inbound direction to select the first packet from among 256 packets. • Configure random sampling in the outbound direction to select one packet randomly from among 1024 packets.
the number of packets for one sampling, and Device selected the first packet from among the 256 packets received on Ethernet 1/2. display sampler 256 Sampler name: 256 Index: 1, Mode: Fixed, Packet counter: 0, Packet-interval: 8 Random number: 1 Total packet number (processed/selected): 256/1 # Execute the display sampler command on Device to view the configuration and running information about sampler 1024.
Configuring PoE Hardware compatibility PoE is available only for MSR50 routers that are installed with the MPU-G2, and MSR30-16, MSR30-20, MSR30-40, MSR30-60, MSR50-40, and MSR50-60 routers that are installed with a PoE-capable switching module. Overview IEEE 802.3af-compliant power over Ethernet (PoE) enables a power sourcing equipment (PSE) to supply power to powered devices (PDs) through Ethernet interfaces over twisted pair cables.
Before configuring PoE, make sure the PoE power supply and PSE are operating properly. Otherwise, either you cannot configure PoE or the PoE configuration does not take effect. If the PoE power supply is turned off while a device is starting up, the PoE configuration in the PoE profile might become invalid. Complete these tasks to configure PoE: Task Remarks Enabling PoE: • Enabling PoE for a PSE Required. • Enabling PoE on a PoE interface Required.
• If the PSE is not enabled with the PoE power management function, you cannot enable PoE for the PSE. • If the PSE is enabled with the PoE power management function, you can enable PoE for the PSE. Whether the PSE can supply power depends on other factors, such as the power supply priority of the PSE. When the sum of the power consumption of all PSEs exceeds the maximum power of PoE, the system considers the PoE to be overloaded.
Step 5. Command Remarks Optional. Configure a description for the PD connected to the PoE interface. poe pd-description text By default, no description for the PD connected to the PoE interface is available. Detecting PDs Enabling the PSE to detect nonstandard PDs There are standard PDs and nonstandard PDs. Usually, the PSE can detect only standard PDs and supply power to them. The PSE can detect nonstandard PDs and supply power to them only if you enable the PSE to detect nonstandard PDs.
The maximum power of the PSE must be greater than or equal to the total maximum power of all critical PoE interfaces on the PSE to guarantee these PoE interfaces of power. To configure the maximum PSE power: Step Command Remarks N/A 1. Enter system view. system-view 2. Configure the maximum power for the PSE. poe max-power max-power pse pse-id Default maximum power of the PSE: • MIM/FIC 16FSW—247 W. • MIM/FIC 24FSW—370 W.
to critical, and this PSE preempts the power of the PSE that has a lower priority level. In this case, the PSE whose power is preempted is disconnected, but its configuration remains unchanged. If you change the priority of the PSE from critical to a lower level, other PSEs have an opportunity to be powered. To configure PSE power management: Step Command Remarks 1. Enter system view. system-view N/A 2. Configure a PSE power management priority policy.
Configuration prerequisites Enable PoE for PoE interfaces. Configuration procedure To configure PoE interface power management: Step Command Remarks 1. Enter system view. system-view N/A 2. Configure PoE interface power management priority policy. poe pd-policy priority By default, this policy is not configured. 3. Enter PoE interface view. interface interface-type interface-number N/A 4. Configure the power supply priority for a PoE interface. Optional.
A PoE profile is a collection of configurations that contain multiple PoE features. On large networks, you can apply a PoE profile to multiple PoE interfaces, and these interfaces have the same PoE features. If the PoE interface connecting to a PD changes to another one, instead of reconfiguring the features defined in the PoE profile one by one, you can apply the PoE profile from the original interface to the current one, simplifying the PoE configurations. The device supports up to 100 PoE profiles.
Step Command Apply the PoE profile to one or multiple PoE interfaces. 2. apply poe-profile { index index | name profile-name } interface interface-range To apply the PoE profile in interface view: Step Command 1. Enter system view. system-view 2. Enter PoE interface view. interface interface-type interface-number 3. Apply the PoE profile to the current PoE interface.
Task Command Remarks Display power information for the PoE power supply and all PSEs. display poe power-usage [ | { begin | exclude | include } regular-expression ] Available in any view. Display PSE information. display poe pse [ pse-id ] [ | { begin | exclude | include } regular-expression ] Available in any view. Display the power supply states of all PoE interfaces connected with the PSE.
Figure 55 Network diagram Configuration procedure # Enable PoE for the PSE. system-view [Sysname] poe enable pse 10 [Sysname] poe enable pse 16 # Set the maximum power of PSE 10 to 400 watts. [Sysname] poe max-power 400 pse 10 # Enable PoE on GigabitEthernet 3/1 and GigabitEthernet 5/1.
Troubleshooting PoE Failure to set the priority of a PoE interface to critical Analysis • The guaranteed remaining power of the PSE is lower than the maximum power of the PoE interface. • The priority of the PoE interface is already set. • In the first case, either increase the maximum PSE power or reduce the maximum power of the PoE interface if the guaranteed remaining power of the PSE cannot be modified. • In the second case, remove the priority that is already configured.
Configuring port mirroring You cannot configure a Layer 2 mirroring group with the source ports and the monitor port located on different cards of the same device, but you can configure that for a Layer 3 mirroring group. The HP MSR routers do not support configuring source ports in CPOS interface view. The HP MSR routers do not support using an aggregate interface as the monitor port.
Port mirroring classification and implementation Port mirroring includes local port mirroring and remote port mirroring based on whether the mirroring source and the mirroring destination are on the same device. Local port mirroring In local port mirroring, the mirroring source and mirroring destination are on the same device. You can configure local port mirroring by using the mirroring-group command or the mirror command.
Step Create a local mirroring group. 2. Command Remarks mirroring-group group-id local No local mirroring group exists by default. NOTE: A local mirroring group takes effect only after you configure a monitor port and source port for it. The following matrix shows the feature and router compatibility: Feature Creating a local mirroring group MSR900 MSR93X Yes Yes Value range for the number: 1 to 5. Value range for the number: 1 to 5. MSR20-1X Yes Value range for the number: 1 to 5.
Configuring the monitor port for the local mirroring group CAUTION: Do not enable the spanning tree feature on the monitor port. Either you can configure the monitor port for a mirroring group in system view, or you can assign the current port to a mirroring group as the monitor port in interface view. The two methods lead to the same result.
Configuring remote port mirroring To configure remote port mirroring by using the mirror command: Step Command Remarks 1. Enter system view. system-view N/A 2. Enter interface view. interface interface-type interface-number N/A 3. Mirror the traffic on the interface to a remote host. mirror number number { all | in | out } to remote-ip ip-address [ port port ] By default, the traffic on an interface is not mirrored.
Figure 56 Network diagram Configuration procedure # Create local mirroring group 1. system-view [DeviceA] mirroring-group 1 local # Configure Ethernet 1/1 and Ethernet 1/2 as source ports, and configure port Ethernet 1/3 as the monitor port. [DeviceA] mirroring-group 1 mirroring-port ethernet 1/1 ethernet 1/2 both [DeviceA] mirroring-group 1 monitor-port ethernet 1/3 # Disable the spanning tree feature on the monitor port Ethernet 1/3.
Configuring traffic mirroring The following matrix shows the feature and router compatibility: Feature MSR900 MSR93X MSR20-1X MSR20 MSR30 MSR50 MSR1000 Configuring traffic mirroring Yes No No No Yes Yes No Overview Traffic mirroring copies specified packets to a specific destination for packet analysis and monitoring. Traffic mirroring is implemented through QoS policies.
For more information about the traffic classifier and if-match commands, see ACL and QoS Command Reference. Mirroring traffic to an interface Step 1. Enter system view. Command Remarks system-view N/A By default, no traffic behavior exists. 2. Create a behavior, and enter behavior view. traffic behavior behavior-name For more information about the traffic behavior command, see ACL and QoS Command Reference. 3. Specify the destination interface for traffic mirroring.
Displaying and maintaining traffic mirroring Task Command Remarks Display user-defined traffic behavior configuration. display traffic behavior user-defined [ behavior-name ] [ | { begin | exclude | include } regular-expression ] Available in any view. Display user-defined QoS policy configuration. display qos policy user-defined [ policy-name [ classifier tcl-name ] ] [ | { begin | exclude | include } regular-expression ] Available in any view.
[DeviceA] acl number 3000 [DeviceA-acl-adv-3000] rule permit tcp source 192.168.2.0 0.0.0.255 destination-port eq www [DeviceA-acl-adv-3000] quit # Create traffic class tech_c, and then configure the match criterion as ACL 3000. [DeviceA] traffic classifier tech_c [DeviceA-classifier-tech_c] if-match acl 3000 [DeviceA-classifier-tech_c] quit # Create traffic behavior tech_b, and then configure the action of mirroring traffic to port Ethernet 1/3.
[DeviceA-Ethernet1/2] qos apply policy mkt_p outbound Verifying the configuration # Verify that you can monitor the following traffic through the server: • All traffic sent by the technical department to access the Internet. • All IP traffic that the technical department sends to the marketing department during working hours.
Configuring the information center Overview The information center collects and classifies system information as follows: • Receives system information including log, trap, and debug information from source modules. • Outputs system information to different information channels, according to user-defined output rules. • Outputs system information to different destinations, based on channel-to-destination associations.
Severity Severity value Description Corresponding keyword in commands Alert 1 Action must be taken immediately to solve a serious problem. For example, traffic on an interface exceeds the upper limit. alerts Critical 2 Critical condition. For example, the device temperature exceeds the upper limit, the power module fails or the fan tray fails. critical Error 3 Error condition. For example, the link state changes or a storage card is unplugged. errors Warning 4 Warning condition.
The following matrix shows the feature and router compatibility: Feature MSR900 Eight output destinations and ten channels Yes. MSR93X MSR20-1 X MSR20 MSR30 MSR50 MSR10 00 Yes. Yes except the log file output destination. Yes. Yes. Yes. Yes. Default output rules of system information A default output rule specifies the system information source modules, information type, and severity levels for an output destination. Table 7 shows the default output rules.
System information formats Formats The system information format varies with output destinations. See Table 8. Table 8 System information formats Output destination Format Example Console, monitor terminal, logbuffer, trapbuffer, SNMP module, or log file timestamp sysname module/level/digest: content %Jun 26 17:08:35:809 2008 Sysname SHELL/4/LOGIN: VTY login from 1.1.1.1.
Field Description • If the system information that is sent to a log host is in the UNICOM format, and Sysname (host name or host IP address) the info-center loghost source command is configured, or the vpn-instance vpn-instance-name option is provided in the info-center loghost command, the sysname field is displayed as the IP address of the device that generated the system information.
Table 10 Description of the timestamp parameters Timestamp parameters boot date Description Example Time since system startup, in the format of xxx.yyy. xxx represents the higher 32 bits, and yyy represents the lower 32 bits, of milliseconds elapsed. %0.109391473 Sysname FTPD/5/FTPD_LOGIN: User ftp (192.168.1.23) has logged in successfully. System information sent to all destinations other than log host supports this parameter. 0.109391473 is a timestamp in the boot format.
Hardware FIPS mode MSR50 Yes. MSR1000 Yes. Information center configuration task list Task Remarks Outputting system information to the console Optional. Outputting system information to the monitor terminal Optional. Outputting system information to a log host Optional. Outputting system information to the trap buffer Optional. Outputting system information to the log buffer Optional. Outputting system information to the SNMP module Optional.
Step Command Remarks Optional. 6. Configure the timestamp format. info-center timestamp { debugging | log | trap } { boot | date | none } By default, the timestamp format for log, trap and debug information is date. 7. Return to user view. quit N/A 8. Enable system information output to the console. terminal monitor Optional. The default setting is enabled. • Enable the display of debug information on the console: terminal debugging 9.
Step Command Remarks Optional. 6. Configure the timestamp format. info-center timestamp { debugging | log | trap } { boot | date | none } By default, the timestamp format for log, trap and debug information is date. 7. Return to user view. quit N/A The default setting is disabled. 8. Enable system information output to the monitor terminal. terminal monitor You must first execute this command, and then you can enable the display of debugging, log, and trap information on the monitor terminal.
Step 6. 7. Configure the timestamp format for system information output to the log host. Set the format of the system information sent to a log host. Command Remarks info-center timestamp loghost { date | iso | no-year-date | none } Optional. date by default. • Set the format to UNICOM: info-center format unicom • Set the format to HP: undo info-center format Optional. HP by default. By default, no log host or related parameters are specified. 8.
Step Command Remarks Optional. 6. Configure the timestamp format. info-center timestamp { debugging | log | trap } { boot | date | none } The timestamp format for log, trap and debug information is date by default. Outputting system information to the log buffer The log buffer only receives log information, and discards trap and debug information. To output system information to the log buffer: Step Command Remarks N/A 1. Enter system view. system-view 2. Enable the information center.
Step Command 2. Enable the information center. info-center enable 3. Name the channel with a specified channel number. info-center channel channel-number name channel-name Remarks Optional. Enabled by default. Optional. See Table 6 for default channel names. Optional. Configure an output channel for the SNMP module. info-center snmp channel { channel-number | channel-name } 5. Configure an output rule for the SNMP module.
Step Command 5. Configure an output rule for the Web interface. info-center source { module-name | default } channel { channel-number | channel-name } [ debug { level severity | state state }* | log { level severity | state state }* | trap { level severity | state state }* ]* 6. Configure the timestamp format. info-center timestamp { debugging | log | trap } { boot | date | none } Remarks Optional. See "Default output rules of system information." Optional.
Step Command Remarks Optional. 7. Configure the directory to save the log files. info-center logfile switch-directory dir-name By default, the log file is saved in the logfile directory under the root directory of the storage device (the root directory of a storage device varies with devices). The configuration made by this command cannot survive a system reboot. Optional. Available in any view. 8. Manually save logs in the log file buffer to a log file.
To solve this problem, you can save security logs into a security log file without affecting the current log output rules. After logging in to the device, the system administrator can enable the saving of security logs into the security log file and configure related parameters. However, the system administrator cannot perform any operations on the security log file. Only the security log administrator who has passed AAA local authentication and logged in to the device can manage the security log file.
Feature MSR900 MSR93X MSR201X MSR20 MSR30 MSR50 MSR100 0 Saving security logs into the security log file Yes. Yes. No. Yes. Yes. Yes. Yes. Managing the security log file Task Command Remarks Display a summary of the security log file. display security-logfile summary [ | { begin | exclude | include } regular-expression ] Optional. Available in user view. Optional. Change the directory of the security log file.
Task Command Remarks • Display the contents of the specified file: more file-url • Display information about all files and folders: dir [ /all ] [ file-url ] • Create a folder in a specified directory on the storage medium: mkdir directory • Change the current working directory: cd { directory | .. | / } • Display the current path: pwd • Copy a file: Perform these operations to the security log file.
Task Command Remarks • Establish an FTP connection: ftp [ server-address [ service-port ] [ [ vpn-instance vpn-instance-name ] | [ source { interface interface-type interface-number | ip source-ip-address } ] ] ] • Establish an FTP connection in (Optional) Upload the security log file to the FTP server.
Disabling an interface from generating link up/down logging information By default, all interfaces generate link up or link down log information when the state changes. In some cases, you might want to disable specific interfaces from generating this information. For example: • You are concerned only about the states of some interfaces. In this case, you can use this function to disable other interfaces from generating link up and link down log information.
Task Command Remarks Display the state and the trap information of the trap buffer. display trapbuffer [ reverse ] [ size buffersize ] [ | { begin | exclude | include } regular-expression ] Available in any view. Clear the log buffer. reset logbuffer Available in user view. Clear the trap buffer. reset trapbuffer Available in user view. The following matrix shows the commands and router compatibility: Command MSR900 MSR93X MSR20-1 X MSR20 MSR30 MSR50 MSR10 00 display logfile buffer Yes.
To avoid output of unnecessary information, disable the output of log, trap, and debug information of all modules on the specified channel (console in this example), and then configure the output rule as needed. # Configure an output rule to enable the ARP and IP modules to send log information that has a severity level of at least informational to the console. (The supported source modules depend on the device model.
# Configure an output rule to output to the log host ARP and IP log information that has a severity level of at least informational. [Device] info-center source arp channel loghost log level informational state on trap state off [Device] info-center source ip channel loghost log level informational state on trap state off 2. Configure the log host: The following configurations were performed on Solaris which has similar configurations to the UNIX operating systems implemented by other vendors. a. b.
Figure 61 Network diagram Configuration procedure Before the configuration, make sure the device and the log host can reach each other. (Details not shown.) 1. Configure the device: # Enable the information center. system-view [Sysname] info-center enable # Specify the host 1.2.0.1/16 as the log host, use the channel loghost to output log information, and specify local5 as the logging facility. By default, log information is output to a log host through channel loghost.
# ps -ae | grep syslogd 147 # kill -9 147 # syslogd -r & Make sure the syslogd process is started with the -r option on a Linux log host. Now, the system can record log information into the log file.
Using ping, tracert, and system debugging Use the ping, tracert, and system debugging utilities to test network connectivity and identify network problems. Ping The ping utility sends ICMP echo requests (ECHO-REQUEST) to the destination device. Upon receiving the requests, the destination device responds with ICMP echo replies (ECHO-REPLY) to the source device.
Figure 62 Network diagram Configuration procedure # Use the ping command on Device A to test connectivity to Device C. ping 1.1.2.2 PING 1.1.2.2: 56 data bytes, press CTRL_C to break Reply from 1.1.2.2: bytes=56 Sequence=1 ttl=254 time=205 ms Reply from 1.1.2.2: bytes=56 Sequence=2 ttl=254 time=1 ms Reply from 1.1.2.2: bytes=56 Sequence=3 ttl=254 time=1 ms Reply from 1.1.2.2: bytes=56 Sequence=4 ttl=254 time=1 ms Reply from 1.1.2.2: bytes=56 Sequence=5 ttl=254 time=1 ms --- 1.1.2.
1.1.1.1 Reply from 1.1.2.2: bytes=56 Sequence=4 ttl=254 time=1 ms Record Route: 1.1.2.1 1.1.2.2 1.1.1.2 1.1.1.1 Reply from 1.1.2.2: bytes=56 Sequence=5 ttl=254 time=1 ms Record Route: 1.1.2.1 1.1.2.2 1.1.1.2 1.1.1.1 --- 1.1.2.2 ping statistics --5 packet(s) transmitted 5 packet(s) received 0.00% packet loss round-trip min/avg/max = 1/11/53 ms The test procedure with the ping –r command (see Figure 62) is as follows: 1.
Figure 63 Traceroute operation Tracert uses received ICMP error messages to get the IP addresses of devices. As shown in Figure 63, tracert works as follows: 1. The source device (Device A) sends a UDP packet with a TTL value of 1 to the destination device (Device D). The destination UDP port is not used by any application on the destination device. 2.
icmp-extensions compliant command on the devices. For more information about this command, see Layer 3—IP Services Command Reference. For an IPv6 network: • Enable sending of ICMPv6 timeout packets on the intermediate devices (devices between the source and destination devices). If the intermediate devices are HP devices, execute the ipv6 hoplimit-expires enable command on the devices. For more information about this command, see Layer 3—IP Services Command Reference.
displayed on a terminal (including console or VTY). You can also send debugging information to other destinations. For more information, see "Configuring the information center." Figure 64 Relationship between the protocol and screen output switch Debugging a feature module Output of debugging commands is memory intensive. To guarantee system performance, enable debugging only for modules that are in an exceptional condition.
Step 4. Command display debugging [ interface interface-type interface-number ] [ module-name ] [ | { begin | exclude | include } regular-expression ] Display the enabled debugging functions. Remarks Optional. Available in any view. Ping and tracert example Network requirements As shown in Figure 65, Device A failed to Telnet Device C. Determine whether Device A and Device C can reach each other. If they cannot reach each other, locate the failed nodes in the network.
4 * * * 5 The output shows that Device A and Device C cannot reach other, Device A and Device B can reach each other, and an error occurred on the connection between Device B and Device C. # Use the debugging ip icmp command on Device A and Device C to verify that they can send and receive the specific ICMP packets, or use the display ip routing-table command to verify the availability of active routes between Device A and Device C.
Configuring IPv6 NetStream Overview Legacy ways to collect traffic statistics, like SNMP and port mirroring, cannot provide precise network management because of inflexible statistical methods or the high cost of required dedicated servers. This calls for a new technology to collect traffic statistics. IPv6 NetStream provides statistics about network traffic flows, and it can be deployed on access, distribution, and core layers.
• NetStream collector (NSC)—The NSC is usually a program running in UNIX or Windows. It parses the packets sent from the NDE, and then it stores the statistics to the database for the NDA. The NSC gathers the data from multiple NDEs. • NetStream data analyzer (NDA)—The NDA is a tool for analyzing network traffic.
IPv6 NetStream aggregation data export IPv6 NetStream aggregation merges the flow statistics according to the aggregation criteria of an aggregation mode, and it sends the summarized data to the IPv6 NetStream server. This process is the IPv6 NetStream aggregation data export, which uses less bandwidth than traditional data export. Table 12 lists the six IPv6 NetStream aggregation modes are supported.
The version 9 format template-based feature provides support of different statistics, such as BGP next hop and MPLS information. IPv6 NetStream configuration task list Before you configure IPv6 NetStream, verify that the following configurations are proper, as needed: • Make sure which device you want to enable IPv6 NetStream on. • Configure the timer for IPv6 NetStream flow aging. • To reduce the bandwidth that IPv6 NetStream data export uses, configure IPv6 NetStream aggregation.
Step 5. Configure the destination address and the destination UDP port number for the IPv6 NetStream traditional data export. Command Remarks ipv6 netstream export host ip-address udp-port [ vpn-instance vpn-instance-name ] By default, no destination address or destination UDP port number is configured, so the IPv6 NetStream traditional data is not exported. Optional. 6. 7. Configure the source interface for IPv6 NetStream traditional data export.
Step Command Configure the destination address and destination UDP port number for the IPv6 NetStream aggregation data export. 6. Remarks ipv6 netstream export host ip-address udp-port [ vpn-instance vpn-instance-name ] By default, no destination address or destination UDP port number is configured in IPv6 NetStream aggregation view. If you expect to export only IPv6 NetStream aggregation data, configure the destination address in related aggregation view only. Optional.
Step Command Remarks Optional. Configure the version for IPv6 NetStream export format, and specify whether to record AS and BGP next hop information. 2. By default: ipv6 netstream export version 9 [ origin-as | peer-as ] [ bgp-nexthop ] • Version 9 format is used to export IPv6 NetStream traditional data, IPv6 NetStream aggregation data, and MPLS flow data with IPv6 fields. • The peer AS numbers are recorded. • The BGP next hop is not recorded.
• Inactive flow aging—A flow is considered inactive if its statistics have not been changed. No packet for this IPv6 NetStream entry arrives in the time specified by the ipv6 netstream timeout inactive command. The inactive flow entry remains in the cache until the inactive timer expires. Then, the inactive flow is aged out and its statistics, which can no longer be displayed by the display ipv6 netstream cache command, are sent to the NetStream server.
Displaying and maintaining IPv6 NetStream Task Command Remarks Display IPv6 NetStream entry information in the cache. display ipv6 netstream cache [ verbose ] [ | { begin | exclude | include } regular-expression ] Available in any view. Display information about IPv6 NetStream data export. display ipv6 netstream export [ | { begin | exclude | include } regular-expression ] Available in any view. Display the configuration and status of the NetStream flow record templates.
# Configure the destination address and the destination UDP port number for the IPv6 NetStream traditional data export. [RouterA] ipv6 netstream export host 12.110.2.2 5000 IPv6 NetStream aggregation data export configuration example Network requirements As shown in Figure 68, configure IPv6 NetStream on Router A so that: • Router A exports IPv6 NetStream traditional data to port 5000 of the NetStream server at 4.1.1.1/16.
[RouterA-ns6-aggregation-as] ipv6 netstream export host 4.1.1.1 2000 [RouterA-ns6-aggregation-as] quit # Configure the aggregation mode as protocol-port, and then, in aggregation view, configure the destination address and the destination UDP port number for the IPv6 NetStream protocol-port aggregation data export. [RouterA] ipv6 netstream aggregation protocol-port [RouterA-ns6-aggregation-protport] enable [RouterA-ns6-aggregation-protport] ipv6 netstream export host 4.1.1.
Support and other resources Contacting HP For worldwide technical support information, see the HP support website: http://www.hp.
Conventions This section describes the conventions used in this documentation set. Command conventions Convention Description Boldface Bold text represents commands and keywords that you enter literally as shown. Italic Italic text represents arguments that you replace with actual values. [] Square brackets enclose syntax choices (keywords or arguments) that are optional. { x | y | ... } Braces enclose a set of required syntax choices separated by vertical bars, from which you select one.
Network topology icons Represents a generic network device, such as a router, switch, or firewall. Represents a routing-capable device, such as a router or Layer 3 switch. Represents a generic switch, such as a Layer 2 or Layer 3 switch, or a router that supports Layer 2 forwarding and other Layer 2 features. Represents an access controller, a unified wired-WLAN module, or the switching engine on a unified wired-WLAN switch. Represents an access point.
Index ACDEFHILMNOPRSTU Configuring the PoE power,156 A Configuring the RMON alarm function,17 Adding a candidate device to a cluster,66 Configuring the RMON statistics function,16 Alarm group configuration example,21 C Configuring the sFlow agent and sFlow collector information,145 Cluster management configuration example,70 Configuring traffic mirroring,171 Contacting HP,219 Cluster management configuration task list,58 Conventions,220 Configuring a PoE interface by using a PoE profile,159 Crea
Outputting system information to the Web interface,187 Ethernet statistics group configuration example,18 F Overview,165 FIPS compliance,181 Overview,73 H Overview,208 Hardware compatibility,153 Overview,23 Overview,54 History group configuration example,19 Overview,171 I Overview,14 Information center configuration examples,195 Overview,150 Information center configuration task list,182 Overview,176 IP accounting configuration example,85 Overview,102 IP traffic ordering configuration exa