
HP MSR2000/3000/4000 Router Series Network Management and Monitoring Command Reference


304
to the screen size, and does not display exceeding processes. You can also input interactive commands
as shown in Table 70 to pe
rform relevant operations.
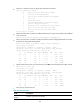
Table 70 Interactive commands
Commands Descri
p
tion
? or h Displays help information that includes available interactive commands.
c Sorts processes by CPU usage in descending order, which is the default setting.
d
Sets the interval for refreshing process statistics, in the range of 1 to 2147483647 seconds.
The default value is 5 seconds.
f
Sorts processes by the number of open files in descending order. Files are identified by file
descriptors (FDs).
k Kills a process. Because the command can impact system operation, be cautious to use it.
l Refreshes the screen.
m Sorts processes by memory usage in descending order.
n
Changes the maximum number of processes displayed within a screen, in the range of 0 to
2147483647. The default value is 10. A value of 0 means no limit. Only processes not
exceeding the screen size can be displayed.
q Quits the interactive mode.
t Sorts processes by running time in descending order.
< Moves sort field to the next left column.
> Moves sort field to the next right column.
Examples
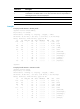
# Display process statistics in dumbtty mode. In this mode, the system displays process statistics once,
and then returns to command view.
<Sysname> monitor process dumbtty
76 processes; 103 threads; 687 fds
Thread states: 1 running, 102 sleeping, 0 stopped, 0 zombie
CPU states: 77.16% idle, 0.00% user, 14.96% kernel, 7.87% interrupt
Memory: 496M total, 341M available, page size 4K
JID PID PRI State FDs MEM HH:MM:SS CPU Name
1047 1047 120 R 9 1420K 00:02:23 13.53% diagd
1 1 120 S 17 1092K 00:00:20 7.61% scmd
1000 1000 115 S 0 0K 00:00:09 0.84% [sock/1]
1026 1026 120 S 20 26044K 00:00:05 0.84% syslogd
2 2 115 S 0 0K 00:00:00 0.00% [kthreadd]
3 3 99 S 0 0K 00:00:00 0.00% [migration/0]
4 4 115 S 0 0K 00:00:06 0.00% [ksoftirqd/0]
5 5 99 S 0 0K 00:00:00 0.00% [watchdog/0]
6 6 115 S 0 0K 00:00:01 0.00% [events/0]
7 7 115 S 0 0K 00:00:00 0.00% [khelper]
4797 4797 120 S 8 28832K 00:00:02 0.00% comsh
5117 5117 120 S 8 1496K 00:00:00 0.00% top
<Sysname>