HP NetServer Performance and Sizing Guidelines Microsoft Windows NT 4.
Notice The information contained in this document is subject to change without notice. Hewlett-Packard makes no warranty of any kind with regard to this material, including, but not limited to, the implied warranties of merchantability and fitness for a particular purpose. Hewlett-Packard shall not be liable for errors contained herein or for incidental or consequential damages in connection with the furnishing, performance, or use of this material.
Contents 2 TEST SUMMARY ............................................................................ 4 Introduction......................................................................................................................4 Processors .........................................................................................................................5 Memory ............................................................................................................................7 Network .
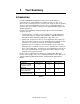
2 Test Summary Introduction In a Microsoft® Windows NT® 4.0, Terminal Server (TSE) multiuser environment users share hardware and software resources on the server. These resources include processors, memory, and storage as well as operating system resources and application resources such as configuration data (e.g., location of directories and files, arrangement of application within groups, and desktop appearance).
Processors In the TSE environment, all users contend for the same processors. In this environment a single CPU-intensive application can adversely effect the performance of all users on the system. As expected, our results also show that as the CPUs become saturated, performance deteriorates significantly and client sessions can become starved. As a result, solutions consisting of well behaved, predictable applications (e.g., order entry applications) are ideally suited for this environment.
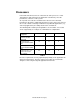
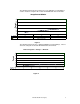
Our tests also show that TSE scales well, evenly sharing the processors among the client sessions. The following chart shows the average and maximum processor utilization for each of the four processors during the 1, 12, 24, 36, 48, 60 and 72 client runs on the HP NetServer LXr 8000. This chart illustrates how evenly processing is shared among the processors. % Processor Utilization 100 90 80 70 60 50 40 30 20 10 0 0 1 12 24 36 48 60 72 P r oce s s or 0 (Avg) 0. 01 0. 05 0. 3 1.66 5. 19 11.
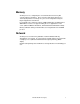
Memory As with processors, configuring the server with insufficient memory will seriously impact performance. Since memory requirements will vary, it is extremely important to accurately size your server configuration using the targeted application environment. For Terminal Server, Microsoft requires 32MB of RAM, plus an additional 4 to 8MB RAM for each user to support running the user's applications on the server (Microsoft Window NT Server, Terminal Server Administrator's Guide).
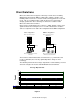
Client Solutions Microsoft Terminal Server supports a full range of client choices including Windows-based Terminals (WBTs), Palmtop PCs, NetPCs, and PCs. This flexibility allows customers to select the client technology that best meets their needs. HP, as a leading provider of both client and server technology, is uniquely positioned to offer a full range of client/server solutions for the Microsoft Terminal Server market. Our tests have shown that the type of client (i.e.
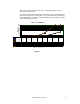
The following chart shows the average processor utilization recorded during 1, 2 and 3 client runs using the HP Vectras and HP Windows-based Terminals. Average Processor Utilization 1 0.9 0.8 0.7 0.6 0.5 0.4 0.3 0.2 0.1 0 1 2 3 PCClients 0.12 0.23 0.34 WBTClients 0.13 0.23 0.35 Number of Client Sessions Figure 3 The following chart shows the % Network Utilization recorded during 1, 2 and 3 client runs using HP Vectra and HP Windows-based Terminals. Network Segment - Average % Network 3 2.5 2 1.
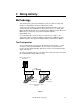
3 Sizing Activity Methodology This sizing activity consisted of running the same test script on various HP NetServer configurations and then comparing the results. A Visual Test 4.0 script, based on the Microsoft Office 95 product suite, was used to automate and standardize the interaction of users (i.e., clients) with Microsoft Windows NT 4.0 Server, Terminal Server Edition using the Microsoft RDP protocol. (Visual Test is a product of Rational Software, www.rational.com.
Microsoft Terminal Server Configurations Server Softare • Microsoft Windows NT 4.0 Server, Terminal Server Edition • Rational Visual Test 4.0 • Microsoft Office 95 Server Hardware HP NetServer LX Pro • Quad Intel Pentium Pro 200 MHz processor with 66 MHz bus • 512KB cache per processor • 2GB RAM • Dual, integrated Ultra Wide SCSI controllers - 4.
Client Configurations In addition to the Windows-based Terminal configuration, the client configurations consisted of a mixture of Pentium-based workstations running either Windows 95 or Windows NT. HP GT210 Windows-based Terminal • 16MB RAM • 10 Base-T Ethernet • Windows CE 2.10 • Microsoft Remote Desktop Client (RDP) HP Vectra VL5 • Intel Pentium/133 processor • 32MB RAM • HP DeskDirect 10/100 TX PCI LAN Adapter • Windows NT 4.
Network The LAN configuration consisted of two cascaded HP AdvancedStack 10Base-T hubs. TCP/IP was used as the transport protocol between the TSE clients and the Microsoft TSE server. The test configuration network was isolated and not connected to any other network segment. Under TSE, the client application actually runs on the server.
Visual Test Scripts For each client session, a Visual Test 4.0 script was used to automatically generate keystrokes. Each client session ran the same script. The script used both Microsoft Word and Microsoft Excel to simulate heavy keystroke activity, pausing only 0.05 seconds between keystrokes that generate generic text and 2 seconds between keystrokes that initiate menu operations.
The following two screenshots were captured during a run of the Visual Test script.
Test Procedures The server and all clients were rebooted prior to each test run. Once the server and clients had successfully booted, the required number of TSE client sessions (i.e., 1-6 client sessions per client workstations) was started on each client. Then, the Performance Monitor was started as a background task on the server. Each Visual Test script was then started manually, as quickly as possible.
Elapsed Time An elapsed time was recorded for each client session. As part of the Visual Test script, the elapsed time was computed and stored in a file on the server’s disk. Elapsed time was calculated by subtracting the time the script started from the time the script finished. The elapsed time includes the time required to load both the Microsoft Word and Microsoft Excel applications. It does not include the time required to establish the TSE client session on the server.
The following chart shows the maximum elapsed time recorded when running 0, 1, 12, 24, 36, 48, 60 and 72 client sessions for each of the tested server configurations.
The following Performance Monitor charts show % Processor Time while performing the 12 client session tests on the HP NetServer LH 3. Figure 11 - 12 Client Sessions (LH 3) The following Performance Monitor charts show % Processor Time while performing the 36 client session tests on the HP NetServer LH 3.
The following Performance Monitor chart show % Processor Time while performing the 72 client session tests on the HP NetServer LH 3. Figure 13 - 72 Client Sessions (LH 3) NOTE As CPU utilization increases, with the increased number of users, the time required to complete the Microsoft Word portion of the script increases.
Average Processor Utilization The following chart shows the average processor utilization recorded when running 1, 12, 24, 36, 48, 60 and 72 client sessions for each of the tested server configurations. Average Processor Utilization 90 80 70 60 50 40 30 20 10 0 1 12 24 36 48 60 72 LXPro 0.15 3.58 14.98 30.97 46.64 68.72 82.68 LPr 0.12 1.42 6.32 18.35 35.41 49.04 64.07 LH3 0.09 1.32 6.65 19.7 33.96 48.46 64.3 LXr8000 0.05 0.43 1.79 5.11 11.48 25.28 37.
Average Processor Queue Length The following chart shows the average processor queue length recorded when running 1, 12, 24, 36, 48, 60 and 72 client sessions for each of the tested server configurations. Average Processor Queue Length 50 45 40 35 30 25 20 15 10 5 0 1 12 24 36 48 60 72 0 0.59 3.14 8.13 15.9 8 31.39 45 LPr 0 0.28 4.51 4.73 15.85 29 .57 39.23 LH 3 0.04 0.21 4.93 6.06 16 .18 28 .55 38.93 0 0 1.74 1.6 4 4.99 9.63 18.
Affect of Delays (“Think” Time) on Processor Utilization The Visual Test script used for this exercise was specifically designed to help characterize, using a limited number of client sessions, multiprocessor utilization on HP NetServers running TSE. When trying to use this data to estimate the actual number of client sessions a server can support, it is very important to remember that even minor changes in the length of the delay between keystrokes will significantly affect processor utilization.
Network Utilization Network activity was monitored and recorded using the Microsoft Performance Monitor. The results are summarized in this section. Network Segment – % Network Utilization The % Network Utilization counter records the percent of network bandwidth in use for the local network segment. The following Performance Monitor chart characterizes the network traffic (i.e., % Network Utilization) while performing the 24 client session test for each of the LH 3.
Network Segment - % Network Utilization The following chart shows average values for the % Network Utilization counter recorded when running 1, 12, 24, 36, 48, 60 and 72 client sessions for each of the tested server configurations. Network Segment - Average % Network Utilization 25 20 15 10 5 0 1 12 24 36 48 60 72 LX Pro 0.15 1.57 3.05 4.5 5.66 6.91 8.09 LPr 0.12 1.51 3.02 4.53 5.64 7.49 9.54 LH3 0.12 1.62 3.18 4.51 5.92 7.42 9.47 LXr 8000 0.13 1.54 3.01 4.42 6 6.87 7.
Memory Utilization Memory activity was monitored using the Microsoft Performance Monitor. Memory – Pages/Second The Pages/Sec counter gives the number of pages read from or written to the disk to resolve references to pages that were not in memory. This is the primary counter for determining whether the server is paging excessively (or “thrashing”). The highest acceptable value for Pages/sec varies from system to system.
Memory – Available Bytes/Committed Bytes The following Performance Monitor chart shows the value of the Average bytes and Committed bytes counters recorded during the 24 client run on the LH 3. The HP NetServer LH 3 was configured with 1GB of RAM. Figure 22 Memory – Pages/Second The following Performance Monitor characterizes the value of the Memory Pages/Second counter while performing the 24 client session test on the LH 3.
The following chart shows the average values for the Pages/Second counter recorded when running 1, 12, 24, 36, 48, 60 and 72 client sessions for each the tested server configurations. Memory - Average Pages/Sec 90 80 70 60 50 40 30 20 10 0 1 12 24 36 48 60 72 LXPro 1.79 7.48 20.34 35.26 42.98 54.64 75.3 LPr 1.53 7.264 23.5 40.48 43.33 70.48 81.33 LH3 1.18 8.12 36.54 59.01 69.01 79.2 85.7 LXr 8000 1.1 7.66 23.67 43.2 63.36 74.13 79.
The following chart shows average memory utilization for the 12, 24, 36, 48, 60 and 72 client sessions for each of the tested server configurations.
About HP Hewlett-Packard Company is a leading global provider of computing, Internet and intranet solutions, services, communications products and measurement solutions, all of which are recognized for excellence in quality and support. HP has 124,600 employees and had revenue of $47.1 billion in its 1998 fiscal year. Information about HP and its products can be found on the World Wide Web at http://www.hp.com/.