
HP Netserver & Microsoft Terminal Server 4.0

Hewlett-Packard Company 18
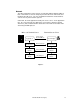
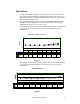
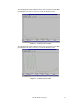
The following chart shows the maximum elapsed time recorded when running
0, 1, 12, 24, 36, 48, 60 and 72 client sessions for each of the tested server
configurations.
Maxim um Elapsed Tim e
0
10 0 0
2000
3000
4000
5000
6000
Number of Client Sessions
LXPro
2396 2364 2376 2502 2746 3123 3517
LPr
2436 2440 2420 2423 2449 2636 2892 3022
LH 3
2433 2436 2422 2429 2453 2619 2841 3128
LXr 8000
2433 2437 2432 2421 2424 2491 2624 2920
0 1 12 24 36 48 60 72
Figure 10
Process Utilization
Processor utilization was monitored and recorded using the Microsoft
Performance Monitor.
Processor - % Processor Time
The % Processor Time counter describes the percent of time a particular
processor is busy.
System - % Total Processor Time
The % Total Processor Time counter describes the percent of time all
processors are busy. In a multiprocessor computer, this counter is equal to
the sum of % Processor Time for each processor divided by the number of
processors. If the server workload is shared equally among all processors,
System: % Total Processor Time is a good measure of processor activity.
System - Process Queue Length
Processor Queue Length is the instantaneous length of the processor queue
in units of threads. All processors use a single queue in which threads wait
for processor cycles. This length does not include the threads that are
currently executing. This is an instantaneous count, not an average over the
time interval.