
HP Netserver & Microsoft Terminal Server 4.0

Hewlett-Packard Company 21
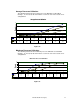
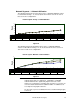
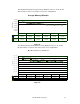
Average Processor Utilization
The following chart shows the average processor utilization recorded when
running 1, 12, 24, 36, 48, 60 and 72 client sessions for each of the tested server
configurations.
Average Processor Utilization
0
10
20
30
40
50
60
70
80
90
Number of Client Sessions
LXPro
0.15 3.58 14.98 30.97 46.64 68.72 82.68
LPr
0. 12 1. 42 6. 32 18. 35 35. 41 49. 04 64. 07
LH3
0. 09 1. 32 6. 65 19.7 33. 96 48. 46 64 .3
LXr 8000
0. 05 0. 43 1.79 5. 11 11. 48 25.28 37. 78
1 122436486072
Figure 14
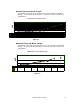
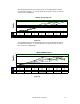
Maximum Processor Utilization
The following chart shows the maximum processor utilization recorded when
running 1, 12, 24, 36, 48, 60 and 72 client sessions for each of the tested server
configurations.
Maximum Processor Utilization
0
20
40
60
80
100
120
Number of Client Sessions
LXPro
4.8 22.98 88.77 100 100 100 100
LPr
4.12 13.84 37.09 93.46 100 100 100
LH3
2.11 15.39 28.69 92.88 100 100 100
LXr 8000\
0.44 4.4 7.23 27.91 62.88 100 100
1 122436486072
Figure 15