
HP Netserver & Microsoft Terminal Server 4.0


Hewlett-Packard Company 22
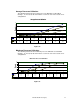
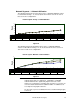
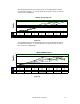
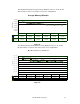
Average Processor Queue Length
The following chart shows the average processor queue length recorded when
running 1, 12, 24, 36, 48, 60 and 72 client sessions for each of the tested server
configurations.
Average Processor Queue Length
0
5
10
15
20
25
30
35
40
45
50
Number of Client Sessions
LX Pr o
0 0.59 3.14 8.13 15.98 31.39 45
LPr
0 0.28 4.51 4.73 15.85 29.57 39.23
LH 3
0.04 0.21 4.93 6.06 16.18 28.55 38.93
LXr 8000
0 0 1.74 1.64 4.99 9.63 18.99
1 12 24364860 72
Figure 16
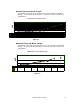
Maximum Processor Queue Length
The following chart shows the maximum processor queue length recorded when
running 1, 12, 24, 36, 48, 60 and 72 client sessions for each of the tested server
configurations.
Maximum Processor Queue Length
0
20
40
60
80
100
120
Number of Client Sessi ons
LX Pr o
0 8 30 43 58 81 84
LPr
0 3 30 38 52 83 112
LH3
2 4 28 46 51 81 87
LXr 8000
0 0 18 36 42 60 94
1 122436486072
Figure 17