
HP Netserver & Microsoft Terminal Server 4.0


Hewlett-Packard Company 25
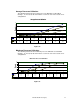
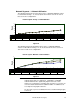
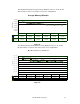
Network Segment - % Network Utilization
The following chart shows average values for the % Network Utilization counter
recorded when running 1, 12, 24, 36, 48, 60 and 72 client sessions for each of
the tested server configurations.
Network Segment - Average %Network Utilization
0
5
10
15
20
25
Number of Client Sessions
LX Pr o
0.15 1.57 3.05 4.5 5.66 6.91 8.09
LPr
0.12 1.51 3.02 4.53 5.64 7.49 9.54
LH 3
0.12 1.62 3.18 4.51 5.92 7.42 9.47
LXr 8000
0.13 1.54 3.01 4.42 6 6.87 7.89
1122436486072
Figure 20
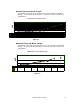
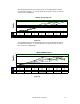
The following chart shows maximum values for the % Network Utilization
counter recorded when running 1, 12, 24, 36, 48, 60 and 72 client sessions for
each of the tested server configurations.
Network Segment - Maximum% Network Utilization
0
5
10
15
20
25
Number of Client Sessions
LX Pr o
0 . 8 4 . 3 7 8 . 9 9 11. 4 7 11. 2 5 11. 2 3 13 . 3 1
LPr
0 .8 5 5. 7 6 9 . 4 7 11. 8 3 11. 5 5 14 . 7 15 .5 4
LH 3
0.86 5.98 9.56 13.17 15.17 16.3 18.27
LXr 8000
0.52 5.65 9.18 13.11 13.33 19.44 19.59
1 12 2436486072
Figure 21
NOTE With a 10 Mbit network, our test results show that, for our script,
network activity was not a bottleneck. Upgrading to a 100 Mbit
network would not have significantly improved our test results.
However, it is important to remember that, for purposes of our test, we
used an isolated network with no additional traffic. In additional, our
test script was not graphics intensive.
As expected, as processor utilization increases network activity begins
to level off.