
HP Netserver & Microsoft Terminal Server 4.0

Hewlett-Packard Company 29
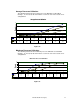
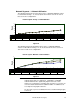
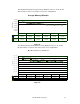
The following chart shows average memory utilization for the 12, 24, 36, 48, 60
and 72 client sessions for each of the tested server configurations.
Average Memory Utilization
0
1,000,000
2,000,000
3,000,000
4,000,000
5,000,000
6,000,000
7,000,000
Number of Client Sessions
Bytes In Use
LX Pro
5,939,803 5,150,701 4,939,483 4,789,735 4,828,637 4,668,010
LPr
5,835,077 5,632,723 5,255,833 4,903,727 4,852,300 4,573,509
LH 3
5,881,445 5,284,968 4,729,108 4,543,929 4,493,780 4,516,668
LXr 8000
6,190,629 5,873,021 5,267,980 4,969,899 4,856,078 4,790,341
12 24 36 48 60 72
Figure 26
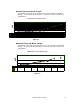
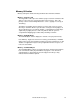
The following chart shows maximum memory utilization for the 12, 24, 36, 48,
60 and 72 client sessions for each of the tested server configurations.
M a x im u m M e m o ry Utiliz a tio n
0
1,000,000
2,000,000
3,000,000
4,000,000
5,000,000
6,000,000
7,000,000
8,000,000
9,000,000
Num ber of Client Sessions
Bytes In Use
LX Pro
7,145,296 6,489,683 6,225,406 6,105,641 5,984,835 5,625,770
LPr
7,579,477 7,375,787 7,180,800 6,574,720 6,539,981 6,063,872
LH 3
7,188,309 6,650,112 6,508,601 6,573,611 6,307,328 6,241,877
LXr 8000
8,246,837 8,142,789 7,886,468 6,911,629 7,144,425 6,275,849
12 24 36 48 60 72
Figure 27