
HP Netserver & Microsoft Terminal Server 4.0

Hewlett-Packard Company 6
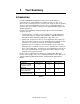
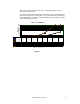
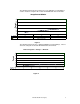
Our tests also show that TSE scales well, evenly sharing the processors
among the client sessions.
The following chart shows the average and maximum processor utilization for
each of the four processors during the 1, 12, 24, 36, 48, 60 and 72 client runs
on the HP NetServer LXr 8000. This chart illustrates how evenly processing is
shared among the processors.
% Processor Utilization
0
10
20
30
40
50
60
70
80
90
100
Number of Client Sessions
Pr ocessor 0(Avg)
0.01 0. 05 0. 3 1.66 5. 19 11.14 25. 01 37. 64
Pr ocessor 1(Avg)
0.04 0.08 0.37 2.02 4.77 11.81 25.26 37.66
Pr ocessor 2(Avg)
0.01 0.04 0.45 1.68 5.18 11.34 25.52 38.05
Pr ocessor 3(Avg)
0.1 0. 03 0.59 1.81 5. 13 11.63 25. 35 37. 79
Processor 0(Max)
0.21 0.78 3.59 6.56 27.99 61.94 100 100
Processor 1(Max)
1.2 1. 46 4.35 11. 03 27. 34 62. 4 100 100
Processor 2(Max)
0.42 0.47 5.47 7.15 28.41 63.85 100 100
Processor 3(Max)
1.09 0.52 5.93 7.54 28.12 63.34 100 100
0 1 12 24 36 48 60 72
Figure 1