
HP Netserver & Microsoft Terminal Server 4.0

Hewlett-Packard Company 9
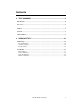
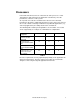
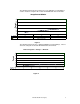
The following chart shows the average processor utilization recorded during 1,
2 and 3 client runs using the HP Vectras and HP Windows-based Terminals.
Average Processor Utilization
0
0.1
0. 2
0. 3
0. 4
0. 5
0. 6
0. 7
0. 8
0. 9
1
Number of Client Sessions
PC Cl i ent s
0. 12 0.23 0.34
WBT Cl i e nt s
0. 13 0.23 0.35
123
Figure 3
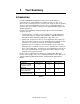
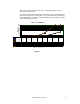
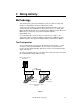
The following chart shows the % Network Utilization recorded during 1, 2 and 3
client runs using HP Vectra and HP Windows-based Terminals.
Network Segment - Average % Network
0
0.5
1
1.5
2
2.5
3
N
umber of Client
PC
0.1
0
.26
0
.37
WBT
0.1
0
.26
0
.37
1
2
3
Figure 4