
HP NetServer FCArray Assistant - Installation and User Guide

Chapter 5 Monitoring
119
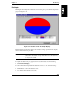
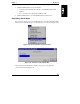
Pie Graph
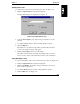
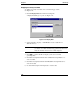
Clicking the Pie Graph tab in Statistics View dialog box opens the Pie Graph data
page. See Figure 5-21.
Figure 5-21. Statistics View: Pie Graph Display
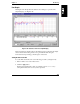
The Pie Graph page displays data for the analysis strings specified in the display
window in the form of a pie chart.
NOTE The operation selected for your analysis strings should be the
same, due to the nature of a pie chart. If it is not, the data may
or may not be useful.
To update the data in the pie graph to the most current data, do the following:
• Click Refresh Display.
To exit from the Pie Graph tab in the Statistics View, do one of the following:
• Click Close to exit from Statistics View.
• Or, click another Statistics View tab.