
5525B/31/32 Line Matrix Printer Code V Programmer's Reference Manual


Design the Form
227
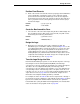
Position Form Elements
6. Each of the various form elements must be properly positioned within the
form. A Justification command (J) can be used to adjust the vertical
position and a Horizontal Tab command (T) can be used to adjust the
horizontal position for the first form element. Position the first element 1.1
inches (
jus
) down from the current print position and 1.0 inches (
dis
) in
from the left margin.
Format: (cc)J
jus
(cc)T
dis
Enter: ^J110^T0100
Create the Box Around the Form
7. The outer box of the form can be input using the Box command (LB). The
box should be 6.0 inches wide (
horz
), 7.4 inches tall (
vert
), with a 3-dot
horizontal (
h
) and vertical (
v
) line thickness.
Format: (cc)LB
horz vert h v
Enter: ^LB0600,0740,3,3
Design the Logo
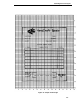
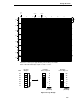
8. Define the logo, and return to the form to add the logo data. The
HandCraft logo is a hand with a sailboat as plotted in Figure 29. Use the
Logo Grid in Appendix C to plot the dot positions for your logo the same
way. Drawing the logo out on a grid permits the dot positions for each
vertical data byte in the logo to be computed and input as data in the
Plotting Graphics (Q) command. Notice that where dot positions are
not
computed, the boat image in the hand emerges.The complete program
for the HandCraft logo starts on page 230.
Translate Logo Design Into Data
Each hexadecimal data byte specifies a seven-bit dot row portion of the logo,
measuring 0.1 inch. The Most Significant Bit (MSB) of the data byte
corresponds to row 7 (the top bit row), and the bit rows continue through the
other bits to the Least Significant Bit (LSB) of the data byte, which
corresponds to row 1 (the bottom row). If the bit is set, a dot is printed in the
corresponding location. A hex data byte value of 7F prints dots in all seven
rows (64 + 32 + 16 + 8 + 4 + 2 + 1); a hex value of 40 (64 decimal) prints a dot
only in bit row 7. Refer to page 105 in the “Commands” chapter for more
information on the Graphics Plotting (Columns) command.
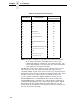
For example, the values in Table 42 have been assigned to bits 1 through 7
for the first 0.1-inch row of data bytes (1 through 42) shown in Figure 29. Each
byte was first calculated in decimal and then converted to the equivalent
hexadecimal value (using the ASCII chart in Appendix A). The hexadecimal
values are the data for the program shown on page 230.