
Availability Guide for Application Design

Instrumenting an Application for Availability
Availability Guide for Application Design—525637-004
8-9
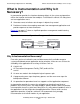
How Does Instrumentation Improve Availability?
Effective instrumentation can help to provide both of these kinds of protection.
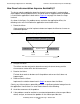
Instrumenting for Failure Prevention
Instrumentation for failure prevention includes:
•
Providing a command interface to monitor and control critical objects within an
application. Such an interface allows the human or automated operator to query
the status of application objects and perform preventive action to ensure the
continued availability of the application.
•
Generating and capturing events that indicate that a resource has crossed a critical
threshold; for example, a disk is 95 percent full. A timely response is enabled to
prevent subsequent outage.
•
Taking performance measurements enables human or automated operators to
take preventive measures if significant performance degradation should occur and
become critical.
Instrumenting for Failure Detection
Instrumentation for failure detection includes generating and capturing events
indicating that a critical object has gone offline; for example, an automated teller is
down or an application software error has been detected. Immediate reactive response
keeps downtime to a minimum.
Refer to Section 9, Minimizing Programming Errors, for information on detecting
application software errors.
Instrumenting for Failure Analysis
While instrumentation cannot provide all the tools and procedures necessary for
analyzing every fault, it can help to make fault analysis possible by:
•
Considering failure data capture in the design state (again, refer to Section 9,
Minimizing Programming Errors). What failure conditions outside of the application
can be disposed of by an automated management application? What detailed
failure data is needed by an automated management application?
•
Including appropriate diagnostic information in generated event messages; for
example, trap number, detailed error codes, stack trace, P-register contents, and
so on
•
Providing a command and response interface to retrieve configuration information,
status of objects, and internal usage statistics
For example, the Pathway application environment has well-defined event messages,
including passthrough of appropriate Guardian error numbers. In addition, the SPI
interface includes INFO, STATUS, and STATS commands for retrieving configuration
information, status of objects, and statistics about the Pathway application.