
Availability Guide for Problem Management


Introduction to Problem Management
Availability Guide for Problem Management–125509
1-3
Measuring Outages
Outage Minutes
While the computer industry often measures availability as percentage of total time,
Tandem recommends measuring availability by outage minutes, assuming 24x7x365
operations. Using an outage-minutes-per-year measurement is easy to understand and
provides more meaningful data than percentage numbers. Table 1-1 compares
percentages with equivalent outage minutes and the resulting user impact.
Measuring Downtime in Minutes
A couple of decades ago, it was reasonable to assume that a computer system should be
available 75 percent of the time. Today, however, reliability standards have increased
substantially. For example, you might well compare a computer system that is available
99.9 percent of the time with a computer system that is available 99.99 percent of the
time.
Now consider the same two computer systems in terms of outage minutes. The first
system is unavailable for 500 minutes during the year while the other system is
unavailable for only 50 minutes during the same year. These values are more meaningful
in view of the fact that the costs of application downtime are usually measured in cost
per minute.
In addition, measuring downtime in minutes makes it easier to understand the benefits of
automated problem resolution. For example, suppose one of your service-level
objectives is to keep downtime to less than 50 minutes per year. If it takes, on average, 5
minutes to manually correct an outage, then your application can tolerate 10 outages per
year, or an average of about 1 outage every 5 weeks. Given that a fully automated
solution to a problem can be accomplished, typically 20 times faster than a manual
solution of the same problem, it follows that you can tolerate up to 200 outages each
year using fully automated solutions, or about one outage every 1.5 to 2 days and
achieve the same goal.
Measuring Downtime in a Client/Server Application
For client/server types of applications it is useful to take measuring downtime a step
further and express it as the number of user outage minutes. A failure in the client part
of the application might affect only one user, but to that user the application is down. A
failure in part of the network could affect several users. A failure in the server, however,
could affect hundreds of users. It is, therefore, important that an outage in the server be
weighted over an outage in the client.
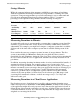
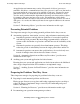
Table 1-1. Outage Minutes per Year (Assuming 24x7x365 Operations)
Percent
Availability 90% 99% 99.9% 99.99% 99.999% 100%
Outage
Minutes/Year* 50,000 5,000 500 50 5 0
User Impact* 35 days 3.5 days 8.3 hours 50 minutes 5 minutes 0 minutes
*Outage minutes per year and user impact days are approximations.