
Availability Guide for Problem Management


Monitoring Event Messages
Availability Guide for Problem Management–125509
4-6
Step 1—Analyzing System Event Messages
Using EMS Analyzer
You can use EMS Analyzer to examine and analyze events to determine the status of the
devices, subsystems, and applications on your system.
EMS Analyzer can read all EMS events generated on a NonStop system and produce an
ENSCRIBE or comma separated value (CSV) database of events. Using EMS Analyzer,
you can generate reports to create a profile of the system and evaluate the number and
type of messages being generated. Other reports might show the number of events per
subsystem, number of critical events per subsystem, and number of critical events per
type of device, communication line, and process.
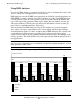
You can download an EMS Analyzer-created CSV database to a personal computer
(PC), where you can use a spreadsheet tool to create graphs and charts that illustrate
event information. Figure 4-1 shows a sample chart of EMS Analyzer data, created with
a spreadsheet tool, that represents a typical week of events generated by a typical
system. It shows that the system generated many informative events, which might not be
used by operators. The chart includes only events generated by Tandem subsystems, not
user applications.
Note. There are more critical event messages than actual problems, because sometimes the
same message is duplicated or the same problem is detected by multiple components, each of
which generates its own events.
Figure 4-1. System Message Analysis Chart Showing EMS Analyzer Data
397
437
424
403
424
142
55
68
122
100
52
248
0
44
1
4
1
2
Mon 07 Dec Tues 08 Dec Wed 09 Dec Thu 10 Dec Fri 11 Dec Sat 12 Dec Sun 13 Dec
Informative
Critical
Action
636
449
Number of Events