
CORBA 2.3.7 Programmer's Guide for C++


Using the trace facility helps you to narrow the problem area to a specific set of interactions. For example, a client
might send a request to an object and never receive a reply. In this case, focusing more narrowly on the server hosting
the object should prove fruitful. NonStop CORBA provides tracing for a number of internal components, which you
can control by using specific trace settings. However, you should be judicious in enabling tracing because the volume
of output can be large.
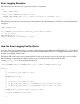
The NonStop CORBA trace facility provides an API that writes trace messages to an ASCII file. You use the trace
facility to implement instrumentation in your NonStop CORBA applications. You can add trace statements to specific
portions of NonStop CORBA applications or components to help troubleshoot program code.
Design of the Trace Facility
The trace facility consists of a single class called NSDOM_Trace. This object provides several methods that write
trace messages out to a specified trace file. To simplify the use of the trace facility, NonStop CORBA provides
several trace macros. The trace macros (and the NSDOM_Trace methods themselves) shield you from the details of
writing trace messages; you need not be concerned with the details of the trace-file format, opening and closing the
trace file, or any platform-specific issues.
When called, the trace facility composes a message based on both user-supplied data and data that the system obtains
during the call. The trace facility then writes the message out to a specified ASCII trace file. The trace facility is
designed so that more than one process can write trace information to a trace file.
The configuration database specifies the file to which the trace facility writes. By default, the trace facility writes to
stdout. If a trace message is generated before ORB_init() is called, the trace facility also writes to stdout.
You can change the location either by using the Console or by using the cfgmgt tool.
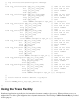
Information Collected in a Trace
Each time a trace message is generated, the trace facility writes the following information to the trace file:
Trace message date and time●
Process name and process ID that produced the trace message●
Thread ID●
Trace data provided by you●
Although most of this information is provided by the system, you must supply a specific trace message. This message
helps to determine where in the code the trace message was generated.
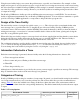
Categories of Tracing
NonStop CORBA provides tracing for a number of components. In general, you should enable tracing for the smallest
set of components that allow you to locate the problem area. The sections that follow provide recommended trace
settings. Table 53 shows the available trace settings. In the first column, the name of the environment variable is
given. The second column shows the corresponding database key. The third column briefly describes the trace output
to expect.
Table 5.2. Tracing Options
Environment Variable
default@trace Database Key
Description
NSDOM_CFG_TRACE_CS comm_server
Comm Server
activity