
CORBA 2.3.7 Programmer's Guide for C++
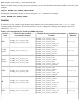
Trace Settings for Application Processes
To enable tracing for an NonStop CORBA client or server process, set one or more environment variables prior to
running the process. For a client process, setting NSDOM_CFG_TRACE_PROXY to TRUE is a useful starting point. If
more detail is needed, enable one or more of the protocol trace variables (depending on the protocols in use by the
client). For a server process, setting NSDOM_CFG_TRACE_POA to TRUE is a useful starting point. If more detail is
needed, enable NSDOM_CFG_TRACE_ORB or enable one or more of the protocol trace variables (depending on the
protocols in use by the server).
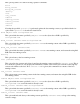
Simple Tracing Example
The following example shows how to add a trace message to your code using the predefined trace macro. In the
example, a message is written to the default ASCII trace file.
#include <nsdorb/trace.h>
main()
{
CORBA::Environment lv_env;
char lv_trace_buf[100];
...
/*perform trace operation */
strcpy(lv_trace_buf, "User-routine while loop");
NSDOM_trace ( lv_trace_buf, strlen(lv_trace_buf ), lv_env);
...
/* using the printf-style trace macro */
NSDOM_tracef ("%s %d", S1, 25);
...
}
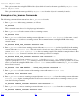
How the Trace Facility Interface Works
As a user of the Trace Facility, you need not know the actual API calls NSDOM_Trace. You should use the trace
macros provided, and let them do the work of calling the API methods. However, if you decide to use your own trace
file you might find it useful to know how the Tracing Facility works.
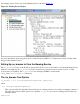
The public section of NSDOM_Trace contains four methods. Three of these methods are used to actually create a
trace message, while the fourth method can be used to create a specific, user-defined trace file (by default, the Trace
Facility writes trace messages to the file specified during system configuration).
//C++ NSDOM_Trace Class
class NSDOM_Trace
{
public:
static void set_trace_file_name(char *pp_trace_fname,
CORBA::Environment &pr_env);