
CORBA 2.3.7 Programmer's Guide for Java
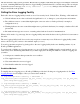
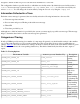
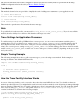

NSDOM_CFG_TRACE_GIOP_FW orb_giop_connections
ORB GIOP
protocol layer
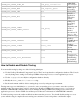
NSDOM_CFG_TRACE_ORB orb_request_queue
ORB request
processing
NSDOM_CFG_TRACE_POA poa
POA activity
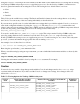
NSDOM_CFG_TRACE_OTS none
NSOTS or
application
transaction
activity
NSDOM_CFG_TRACE_PROXY
NSDOM_CFG_TRACE_PROXY_DETAIL
orb_proxy
ORB proxy
processing:
method
dispatches and
results of
method
invocations. If
detail, the
GIOP messages
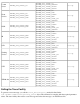
NSDOM_CFG_TRACE_THREADS threads
NonStop
CORBA thread
framework
NSDOM_CFG_TRACE_TIMER event_time
NonStop
CORBA timer
objects
NSDOM_CFG_TRACE_DETAIL none
Sets verbose
tracing
NSDOM_CFG_TRACE_FULL_BUFFERING none
If STDOUT is
configured, sets
full buffering
on (default is
full buffering)
How to Enable and Disable Tracing
You can enable tracing by using one of the following techniques:
Use the NonStop Distributed Component Console. The Console updates the configuration database. The Console
can only change trace settings for NonStop CORBA subsystem processes, not user application processes.
●
Use the cfgmgt tool to modify the configuration database directly.●
Modify the $NSD_ROOT/bin/nsdstart script.●
Set the environment variables before starting the processes by using an export statement.●
Tracing starts at process initialization, so you need to start or restart the process you want to trace after you have
enabled tracing. You can use the Console to start and stop NonStop CORBA subsystem processes, or you can use
Guardian or PATHCOM commands. The Console manages NonStop CORBA subsystem processes, but not user
application processes. See the TS/MP System Management Manual for information on PATHCOM commands.
To disable tracing, reverse the earlier modification, then restart the processes. You should disable tracing as soon as
your troubleshooting is completed because tracing can consume resources and produce considerable output.