
CORBA 2.6 Programmer's Guide for Java

Information Collected in a Trace
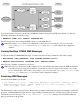
Each time a trace message is generated, the trace facility writes the following information to the trace file:
Trace message date and time●
Process name and process ID that produced the trace message●
Thread ID●
Trace data provided by you●
Although most of this information is provided by the system, you must supply a specific trace message. This message
helps to determine where in the code the trace message was generated.
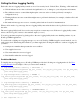
Categories of Tracing
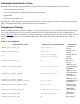
NonStop CORBA provides tracing for a number of components. In general, you should enable tracing for the smallest
set of components that allow you to locate the problem area. The sections that follow provide recommended trace
settings. Table 53 shows the available trace settings. In the first column, the name of the environment variable is given.
The second column shows the corresponding database key. The third column briefly describes the trace output to
expect.
Table 5.2. Tracing Options
Environment Variable
default@trace Database Key
Description
NSDOM_CFG_TRACE_CS comm_server
Comm Server
activity
NSDOM_CFG_TRACE_ES event_svc
Event Service
activity
n/a
trace (in NS@name
_service_settings)
Naming Service
activity
NSDOM_CFG_TRACE_IR ir
Interface
Repository
activity
NSDOM_CFG_TRACE_GCFEH event_context_free
ORB low-level
event handling for
TS/MP I/O
NSDOM_CFG_TRACE_GFSEH event_file_system
ORB low-level
event handling for
Guardian
file-system I/O
NSDOM_CFG_TRACE_SOCKEH
NSDOM_CFG_TRACE_SOCKEH_DETAIL
event_socket
ORB low-level
event handling for
TCP/IP I/O
NSDOM_CFG_TRACE_EVENT_CORE event_core
ORB low-level
event handling
NSDOM_CFG_TRACE_GIOP_FW orb_giop_connections
ORB GIOP
protocol layer
NSDOM_CFG_TRACE_ORB orb_request_queue
ORB request
processing
NSDOM_CFG_TRACE_POA poa
POA activity