
CORBA 2.6.1 Programmer's Guide for Java

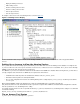

Console or by using the cfgmgt tool.
Information Collected in a Trace
Each time a trace message is generated, the trace facility writes the following information to the trace file:
Trace message date and time
Process name and process ID that produced the trace message
Thread ID
Trace data provided by you
Although most of this information is provided by the system, you must supply a specific trace message. This message helps to determine where
in the code the trace message was generated.
Categories of Tracing
NonStop CORBA provides tracing for a number of components. In general, you should enable tracing for the smallest set of components that
allow you to locate the problem area. The sections that follow provide recommended trace settings.
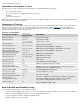
Table 5–3 shows the available trace
settings. In the first column, the name of the environment variable is given. The second column shows the corresponding database key. The
third column briefly describes the trace output to expect.
Table 5.2. Tracing Options
Environment Variable
default@trace
Database Key
Description
NSDOM_CFG_TRACE_CS comm_server
Comm Server activity
NSDOM_CFG_TRACE_ES event_svc
Event Service activity
n/a trace (in NS@name
_service_settings)
Naming Service activity
NSDOM_CFG_TRACE_IR ir
Interface Repository activity
NSDOM_CFG_TRACE_GCFEH event_context_free
ORB low-level event handling for TS/MP I/O
NSDOM_CFG_TRACE_GFSEH event_file_system
ORB low-level event handling for Guardian file-system I/O
NSDOM_CFG_TRACE_SOCKEH
NSDOM_CFG_TRACE_SOCKEH_DETAIL
event_socket
ORB low-level event handling for TCP/IP I/O
NSDOM_CFG_TRACE_EVENT_CORE event_core
ORB low-level event handling
NSDOM_CFG_TRACE_GIOP_FW orb_giop_connections
ORB GIOP protocol layer
NSDOM_CFG_TRACE_ORB orb_request_queue
ORB request processing
NSDOM_CFG_TRACE_POA poa
POA activity
NSDOM_CFG_TRACE_JTS none
Java application transaction activity
NSDOM_CFG_TRACE_OTS none
NSOTS or application transaction activity
NSDOM_CFG_TRACE_PROXY
NSDOM_CFG_TRACE_PROXY_DETAIL
orb_proxy
ORB proxy processing: method dispatches and results of method
invocations. If
detail, the GIOP messages
NSDOM_CFG_TRACE_THREADS threads
NonStop CORBA thread framework
NSDOM_CFG_TRACE_TIMER event_time
NonStop CORBA timer objects
NSDOM_CFG_TRACE_DETAIL none
Sets verbose tracing
NSDOM_CFG_TRACE_FULL_BUFFERING none
If STDOUT is configured, sets full buffering on (default is full buffering)
NSDOM_CFG_TRACE_PI
NSDOM_CFG_TRACE_PI_DETAIL
pi
Traces basic Portable Interceptor activity. If detail, add data
representation during portable interceptor processing
NSDOM_CFG_TRACE_SSL ssl
NonStop CORBA SSLIOP activity
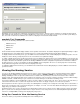
How to Enable and Disable Tracing
You can enable tracing by using one of the following techniques:
Use the NonStop Distributed Component Console. The Console updates the configuration database. The Console can only change trace
settings for NonStop CORBA subsystem processes, not user application processes.
Use the cfgmgt tool to modify the configuration database directly.
Modify the $NSD_ROOT/bin/nsdstart script.