
CORBA 2.6.1 Programmer's Guide for Java


Calling the Trace Facility
To generate a trace message, you call the trace_data or trace() method defined in the com.tandem.nsdom.Config.Config_Trace object. The
call must be complete with the required parameter values. The trace facility then creates a trace message and writes the message to an ASCII
trace file.
The trace file information and other configuration data used by the trace facility must be specified in the NonStop CORBA configuration before
the call (see
How to Enable Tracing).
Trace Methods
The methods shown below are provided to simplify the task of adding trace statements to your application code.
// trace data method
static void trace(String trace_data);
// trace method
void trace(String trace_data);
These methods open the trace file and write the trace message.
Note:
To specifically close the trace file, you must call
Config_Trace.close_trace_file(). If you do not call this method,
the trace facility closes the trace file when the current process exits.
Trace Settings for Application Processes
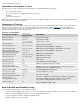
To enable tracing for a NonStop CORBA client or server process, set one or more environment variables prior to running the process. For a
client process, setting
NSDOM_CFG_TRACE_PROXY to TRUE is a useful starting point. If more detail is needed, enable one or more of the protocol
trace variables (depending on the protocols in use by the client). For a server process, setting
NSDOM_CFG_TRACE_POA to 1 is a useful starting
point. If more detail is needed, enable
NSDOM_CFG_TRACE_ORB or enable one or more of the protocol trace variables (depending on the protocols in
use by the server).
Simple Tracing Example
The following example shows how to add a trace message to your code using a trace method. In the example, a message is written to the
default ASCII trace file.
import com.tandem.nsdom.Config.Config_Trace;
void {
// Perform trace operation
Config_Trace.trace ("User_routine trace");
...
}
How the Trace Facility Interface Works
As a user of the trace facility, you do not need to know how the actual API calls are done. You should use the trace methods provided.
However, you might find it useful to know how these methods work. All tracing is managed through the trace interface. When this class is
loaded, a default trace object is automatically created. You can obtain the default trace object by using
get_default. The public section of
com.tandem.nsdom.Config.Config_Trace contains six methods as shown in the following example:
//com.tandem.nsdom.Config.Config_Trace Class
public Config_Trace(String pp_file_name) {
public void close_trace_file();
public static Config_trace get_default();
public void open_trace_file();
public void set_trace_file_name(String pp_trace_file_name);
public static void trace(String pp_trace_data);
public void trace_data(String pp_trace_data);
}
Trace Method Descriptions
Two methods are used to create a trace message: trace() and trace_data(). One sets the trace filename: set_trace_file_name(). Two others
open
open_trace_file() and close close_trace_file() the trace file. And another gets the default trace object: get_default().
Of the two trace message creation methods,
trace() traces the specified data to the default trace object. The trace_data() method traces the
specified data using the instance of the trace object.
When you open a trace file using the open_trace_file() method, any previously opened trace file is automatically closed. The
close_trace_file() method does not automatically close the trace file until the current process exits. If the ref count goes to 0, the trace file is
closed.
The set_trace_file_name() provides an option to specify a user-defined trace filename. This method allows you to override the default trace file
specified in the configuration database. To create a user-specified trace file, you must call this method before making any calls to
open_trace_file().