
Data Transformation Engine Database Interface Designer Reference Guide

Chapter 10 - Debugging and Viewing Results Database Trace Files
Database Interface Designer Reference Guide
145
♦ The database trace file produced at map execution time records detailed
information about the database adapter activity such as records retrieved, data
source and target activity, and so on.
Format of Database Trace Files
Information displayed in the database trace file varies depending upon the
database generating the trace file. Database adapter trace files contain what
appears to be a range of numbers at the beginning of each line in the file. These
numbers represent:
♦ the process ID
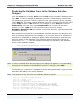
This is the number representing the process that is running on the machine. If
you were watching the processes running on your machine (viewing the
Processes tab in the Task Manager window , the value displayed in the PID
(process ID) column would match the value displayed in the database trace file
produced as a result of this process.
♦ the thread ID
This ID distinguishes each map that is running concurrently. Each running map
has its own thread.
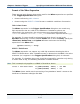
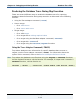
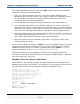
Refer to the following example of these ID numbers:
<1324-3020>: Validating the adapter command...
<1324-3020>: Database type is MS SQL Server 7
<1324-472>: Connecting...
<1324-472>: Datalink: MY_NT_SERVER\\test
<1324-472>: UserId : test
<1324-472>: Password:****
<1324-472>: OLE DB Error code: 0x80004005
<1324-472>: [DBNMPNTW]Specified SQL server not found.
<1324-472>: Returned status: (-3) No error text found
In this example, there is one process ID (1324) and two threads (3020 and 472).
Process ID
Thread ID
Thread ID