
Data Transformation Engine Design Studio Tutorial


Chapter 15 - Creating a Trace File Viewing the Trace File
Design Studio Tutorial
261
Creating a Trace File
Turn on the trace file only for debugging purposes. The trace file can slow down
execution.
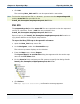
To create a trace file for the Executable map
1 Open the New_POS map source file.
2 Select the Executable map in the Navigator.
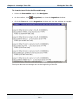
3 From the Map menu, choose Settings.
4 Right-click MapTrace and choose Expand All to view the map trace settings.
5 For the ContentTrace > Switch setting, choose ON.
6 Click OK.
7 Build and run the Executable map.
The trace file is created.
If you ran a map and got a message that an input was invalid, turn on the input
trace only. If you got a message that an output was invalid, turn on the output
trace only.
Changing MapTrace Settings
Use the MapTrace settings in the Map Settings dialog box to change the
location, name, and contents of the trace file.
Note Read the Help for any field to determine the value and options for that setting.
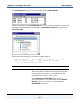
Viewing the Trace File
After you execute a map, you can view the trace file on the Trace tab in the
organizer window. If you trace both input and output, the input messages are at
the beginning of the file, followed by the output messages.
In the trace file, the symbol \r indicates a carriage return. The symbol \n
indicates a linefeed.
Note The DI number and X number are not used for debugging purposes and may be
ignored.