
Debug Manual


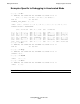
Table Of Contents
- What’s New in This Manual
- About This Manual
- 1 Introduction
- Execution Modes on TNS/R Systems
- What User Access Is Required for Debugging
- How to Make a Process Enter Debug
- How to Select Debug as the Debugger
- Why a Process Enters Debug
- How to Determine Process State on a Trap or Signal
- Ending a Debug Session
- What Appears in the Debug Header Message
- How to Use Debug
- How Debug Breakpoints Work
- 2 Using Debug on TNS/R Processors
- 3 Debug Command Overview
- 4 Debug Commands
- Command Summary
- A Command
- AMAP Command
- B Command
- BASE Command
- BM Command
- C Command
- CM Command
- D Command
- DJ Command
- DN Command
- EX[IT] Command
- F[ILES] Command
- FC Command
- FN Command
- FNL Command
- FREEZE Command
- HALT Command
- H[ELP] Command
- I Command
- IH Command (TNS/R Native and OSS Processes)
- INSPECT Command
- LMAP Command
- M Command
- MH Command (TNS/R Native and OSS Processes)
- P[AUSE] Command
- PMAP Command (Accelerated Programs)
- PRV Command
- R Command
- S[TOP] Command
- T Command
- V Command
- VQ Command
- VQA Command
- = Command
- ? Command
- A Error Messages
- B ASCII Character Set
- C Command Syntax Summary
- Register Syntax
- Expression Syntax
- Address Syntax
- A Command
- AMAP Command
- B Command
- BASE Command
- BM Command
- C Command
- CM Command
- D Command
- DJ Command
- DN Command
- EX[IT] Command
- F[ILES] Command
- FC Command
- FN Command
- FNL Command
- FREEZE Command
- HALT Command
- H[ELP] Command
- I Command
- IH Command
- INSPECT Command
- LMAP Command
- M Command
- MH Command
- Output-Device Syntax
- P[AUSE] Command
- PMAP Command
- PRV Command
- R Command
- S[TOP] Command
- T Command
- V Command
- VQ Command
- VQA Command
- = Command
- ? Command
- D Session Boundaries
- E Correspondence Between Debug and Inspect Commands
- F Sample Debug Sessions
- Glossary
- Index

Debug Commands
Debug Manual—421921-003
4-29
Set Trace Memory-Access Breakpoint
Set Trace Memory-Access Breakpoint
The BM command can set a trace memory-access breakpoint. A trace memory-access
breakpoint causes Debug to list the contents of specified variables each time the
breakpoint location is accessed in the specified manner. The trace form of the BM
command is:
address
is the address where the breakpoint is to occur. For more information, see Address
Syntax on page 3-12.
access
indicates the type of memory access that triggers the breakpoint. Valid options
depend on the type of processor you are using, as noted in list:
register
is a processor register. For more information, see Set Trace Code Breakpoint on
page 4-13 for description of this parameter.
start-address
is the address of the first variable to be listed. The syntax for start-address is
the same as the Address Syntax on page 3-12, limited to data locations only.
?
means list.
count
is a 16-bit expression representing the number of 16-bit words to be listed.
ALL
For more information, see Set Unconditional Memory-Access Breakpoint on page 4-24
for the description of this option.
BM address , access
{, {register | start-address } ? count [, ALL ] }
{ [ , ALL ] {register | start-address } ? count }
R Break on a read access
RW Break on a read/write access
WR Break on a read/write access; equivalent to RW
W Break on a write access