
Debug Manual


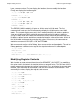


Table Of Contents
- What’s New in This Manual
- About This Manual
- 1 Introduction
- Execution Modes on TNS/R Systems
- What User Access Is Required for Debugging
- How to Make a Process Enter Debug
- How to Select Debug as the Debugger
- Why a Process Enters Debug
- How to Determine Process State on a Trap or Signal
- Ending a Debug Session
- What Appears in the Debug Header Message
- How to Use Debug
- How Debug Breakpoints Work
- 2 Using Debug on TNS/R Processors
- 3 Debug Command Overview
- 4 Debug Commands
- Command Summary
- A Command
- AMAP Command
- B Command
- BASE Command
- BM Command
- C Command
- CM Command
- D Command
- DJ Command
- DN Command
- EX[IT] Command
- F[ILES] Command
- FC Command
- FN Command
- FNL Command
- FREEZE Command
- HALT Command
- H[ELP] Command
- I Command
- IH Command (TNS/R Native and OSS Processes)
- INSPECT Command
- LMAP Command
- M Command
- MH Command (TNS/R Native and OSS Processes)
- P[AUSE] Command
- PMAP Command (Accelerated Programs)
- PRV Command
- R Command
- S[TOP] Command
- T Command
- V Command
- VQ Command
- VQA Command
- = Command
- ? Command
- A Error Messages
- B ASCII Character Set
- C Command Syntax Summary
- Register Syntax
- Expression Syntax
- Address Syntax
- A Command
- AMAP Command
- B Command
- BASE Command
- BM Command
- C Command
- CM Command
- D Command
- DJ Command
- DN Command
- EX[IT] Command
- F[ILES] Command
- FC Command
- FN Command
- FNL Command
- FREEZE Command
- HALT Command
- H[ELP] Command
- I Command
- IH Command
- INSPECT Command
- LMAP Command
- M Command
- MH Command
- Output-Device Syntax
- P[AUSE] Command
- PMAP Command
- PRV Command
- R Command
- S[TOP] Command
- T Command
- V Command
- VQ Command
- VQA Command
- = Command
- ? Command
- D Session Boundaries
- E Correspondence Between Debug and Inspect Commands
- F Sample Debug Sessions
- Glossary
- Index
Sample Debug Sessions
Debug Manual—421921-003
F-39
Native Program Example
T Command
We resume the program. After reaching the breakpoint, we use the T and TN
commands to trace the stack and show the names:
Clear Breakpoint at the Current Location
If the program is stopped at a code breakpoint, you need to specify only the C
command to clear the breakpoint. We will look at the breakpoints before and after this
operation.
The EXAMPLE_FILL_ARRAY procedure uses one of the previously allocated
segments. We can see the current segment in use with the ? command and display the
ARRAY_NUM parameter at $SP + %h82. Note that ARRAY_NUM is only 2 bytes long.
The :d part of the command caused the 32-bit word to break into two 16-bit words.
When we resume the program, it puts data segment 1 into use, then prompts us for
some data. We enter "abcdefg". The program places the input data in a local buffer,
then moves it to the data segment. At this point of our example, we arrive at the
050,03,00266-t
DEBUG $PC=0x70000478 -RISC BREAKPOINT ($PC: 0x70000478)-
050,03,00266-t
0x70000478 VFP=0x4FFFFEE8 UCr
0x4FFFFE9C: 0x7000066C VFP=0x4FFFFF30 UCr
050,03,00266-tn
0x70000478 VFP=0x4FFFFEE8 EXAMPLE_FILL_ARRAY + 0x14
0x4FFFFE9C: 0x7000066C VFP=0x4FFFFF30 EXAMPLE_MAIN + 0xFC
050,03,00266-b
N: 0x70000478 INS: 0x3C048000
INS: LUI a0,0x8000
N: 0x70000568 INS: 0x03E00008
INS: JR ra
050,03,00266-c
050,03,00266-b
N: 0x70000568 INS: 0x03E00008
INS: JR ra
050,03,00266-?
USE SEGMENT ID = NONE
BASE STANDARD IN
BASE STANDARD OUT
TERM \M5.$ZTN00.#PTUGRB0
PRV = OFF
050,03,00266-DN $sp+ %h82, 1 :d
4FFFFEEA: #00001 #00000