
Event Management Service (EMS) Analyzer Manual


Command Descriptions
Event Management Service (EMS) Analyzer Manual–133700
5-33
INFO
•
Dumplog Status is the number of seconds between each display of a status line
showing information about current search, for example: Current position, Events
passed, Events read. If the Dumplog Status is set to OFF, no status lines are
displayed.
•
Starttime is the time after which the events can be selected if they correspond
to filter parameters. No events are selected before this time.
•
Stoptime is the time after which no events are selected. All events before this
time can be selected if they correspond to filter parameters.
•
Eventnumber is all the events with this particular event-number can be
selected, if they correspond also to other filter parameters.
•
Eventtype is the type of the events that can be selected, for example: ALL,
CRITICAL or ACTION.
•
Processid is all the events with this particular process-id can be selected, if
they correspond also to other filter parameters. It can be a process name or a cpu or
a cpu pin.
•
Ssid is all the events with this particular ssid can be selected, if they correspond
to other filter parameters.
•
System is all the events coming from this particular system (node) can be
selected, if they correspond also to other filter parameters.
•
Ldev is all the events with this particular logical device can be selected, if they
correspond also to other filter parameters. It can be a logical device name or number.
•
Text is all the events with this particular text string can be selected, if they
correspond also to other filter parameters.
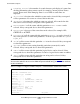
This is a sample of output for EMS Analyzer’s own distributor with no filter value:
Note. The asterisk (*) indicates attributes that you can alter by using the ALTER command.
You can alter attributes for the current EMS Analyzer distributor only; you cannot alter attributes
of other distributors.
-> INFO DISTRIBUTOR $Z679
EMSA INFO DISTRIBUTOR $Z679
Distributor type. CONSUMER
*Filter..........
*Emslog.......... $0.#ZSPI
Coll log......... $SYSTEM.ZLOG00.ZZEV0174
Current log...... $SYSTEM.ZLOG00.ZZEV0174
*EventDB.........
*EventDB type....
*EventDB extents. (20,100,16)
*Format.......... TEXT
*Dumplog Status.. 5 seconds
Search criteria
*Starttime... *Stoptime..