
GDSX (Extended General Device Support) Manual

Design and Development
Extended General Device Support (GDSX) Manual—529931-001
2-81
Selecting Trace Events Supported by TSCODE
4. When GDSX processing is done, stop the trace session:
-> TRACE PROCESS $GDSX, STOP
-> EXIT
5. Run the PTrace utility to display all records in the file TRCFILE:
> PTRACE
? FROM TRCFILE
? OCTAL ON
? RECORD ALL
Selecting Trace Events Supported by TSCODE
The first step in tracing a GDSX process is to decide what events you want to trace.
Then determine from Table 2-4 which of these events TSCODE automatically
generates trace records. Read the descriptions of events traced in the fourth column
of the table, checking for those events you want to trace. Make a note of the trace
classes (a class includes several event types) in the first column in which the events
fall.
When you start the trace, you directly or indirectly (by means of SCF) set the
appropriate trace^control^flags (or auto^trace^flag) for these trace classes. (See
Turning On the Trace Facility on page 2-86.)
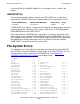
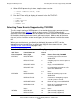
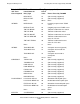
Table 2-4. TSCODE Trace Classes and Entry Types (page1of3)
SCF Trace
Class Keyword
Literal Name for
Entry Type
Literal
Value Events Traced by TSCODE
EXTREQ REQ^IN^APPL 1 Incoming request occurred on
$RECEIVE
REQ^OUT^IOP 2 Outgoing request sent to a process
or IOP
REQ^RET^APPL 3 Reply sent to $RECEIVE
REQ^RET^IOP 4 I/O completion occurred on a file
other than $RECEIVE
None 5-7 None
EXTDATA DATA^IN^APPL 8 Buffer of incoming request on
$RECEIVE
DATA^OUT^IOP 9 Parameters of outgoing request
sent to a process or IOP
DATA^RET^APPL 10 Buffer of reply sent to $RECEIVE
DATA^RCV^IOP 11 Buffer of I/O completion on file
other than $RECEIVE
None 12-15 None
INTREQ REQ^IN^SR 16 (Not currently supported)
REQ^OUT^SR 17 (Not currently supported)