
GDSX (Extended General Device Support) Manual

Design and Development
Extended General Device Support (GDSX) Manual—529931-001
2-87
Turning On the Trace Facility
The trace facility is turned on in four different ways:
1. Enter the following PARAM command at the TACL prompt:
> PARAM DEBUGFLAGS 16
The PARAM command should be entered before creating the GDSX process. This
traces all TSCODE events described in Table 2-6 as well as all USCODE-defined
events.
2. Within USCODE, set auto^trace^flag to 1, as defined in the config^template section
of DCCBDECS. This traces all TSCODE events described in Table 2-6 as well as
all USCODE-defined events.
3. Open the trace file with the USER^OPEN^TRACE^FILE procedure. This
procedure causes TSCODE to allocate an extended segment for a trace file, which
is saved as TRACEP by a primary process or as TRACEB by a backup process.
After the trace file is open, depending on the settings of auto^trace^flag and
trace^control^flags, TSCODE automatically generates trace entries for the file.
You may also generate trace entries by calling ADD^TRACE^DATA or
ADD^TRACE^DATA^INT.
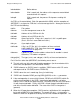
4. Issue an SCF command to start the trace. For example:
-> TRACE PROCESS $GDSX, SELECT SRMISC, TO MYTRACE
generates trace records for the SRMISC trace class. SCF requires a trace file
name. In this example, the trace file is named MYTRACE and is saved in the
subvolume where SCF is running.
The command:
-> TRACE PROCESS $GDSX, SELECT ALL, TO MYTRACE
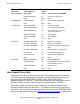
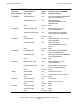
traces all TSCODE events described in Table 2-6 and all USCODE-defined events.
The trace classes are defined by means of the SELECT option:
SELECT select-spec
where select-spec is one of the following specifications:
{ keyword }
{ ( keyword [ , keyword ] ... ) }
To view trace options settings, enter:
-> HELP GDS TRACE PROCESS
See the SCF Reference Manual for GDSX for the complete syntax of the TRACE
PROCESS command.
Note. DEBUGFLAGS is a bit-encoded configuration parameter—see GDSX Configuration
Parameters on page 2-46 for details.