
GPA Manual for G-series RVUs


Guardian Performance Analyzer (GPA) Manual – (544977-001) Page 38 of 106
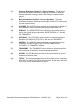
(9)
DISK VOLUME QUEUING: Excessive disk volume queuing. The
request queue time for one or more disk volumes on the node is too
high.
(10)
BLOCKED REQUESTS: No blocked requests. A blocked request is
one that cannot be processed because another application has
blocked access to a record, row, table, or file.
(11)
AVERAGE CACHE HIT %: Average cache hit percentage of 83.20.
The average cache hit percentage is an average of the cache hit
percentages of all the volumes on the system. It is an indication of
how well the current cache settings are performing.
(12)
TOTAL CACHE CALL RATE: Total cache call rate of 25.00 per
second. The cache call rate indicates the degree of disk activity on
the node.
System Performance Score
This subsection of the report (Example 3-4) rates the performance of the node and its
subsystems from 0 to 100%, with a score of 100% being best. Note that these scores
are not absolute values. They merely indicate the quality of performance of the
subsystems and show which of the subsystems might profit from corresponding tuning
changes.
The system recovery performance score indicates how well the system would be able
to continue performing if any of the processors were to fail.
The weighted analysis system score is a weighted average of the subsystem scores. If
GPA finds that either the CPU or memory subsystems have a performance score of
1% or less, it assigns a value of 1%. In these cases, the weighted analysis system
score is set to 1% also.
The individual scores are detailed in The Detail System Performance Score Reports
in Section 4: Using GPA Information
.