
GPA Manual for G-series RVUs


Guardian Performance Analyzer (GPA) Manual – (544977-001) Page 39 of 106
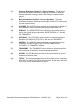
Example 3-4. System Performance Score
IV. SYSTEM PERFORMANCE SCORE
1. CPU SUBSYSTEM 1%
2. MEMORY SUBSYSTEM 1%
3. DISK CACHE SUBSYSTEM 83%
4. DISK VOLUME SUBSYSTEM 9%
5. SYSTEM RECOVERY PERFORMANCE 52%
*6. WEIGHTED ANALYSIS SYSTEM SCORE 1%
* Average Score rated: BEST = 100, WORST = 0.
Process and Busy Distribution Analyses
The Process and Busy Distribution Analyses section of the report (Example 3-5) is
broken into two parts, which give you an overview of how the system is being utilized
by class of process and by CPU.
Example 3-5. Process and Busy Distribution Analyses
1
OVERVIEW Process Distribution Analysis - Process Counts
Class Cpu Cpu Cpu Cpu Tot
Name #00 #01 #02 #03 Cnt
-------- --- --- --- --- ----
3
SYSTEM 70 70 52 52 244
4
SUBSYS 14 13 3 2 32
5
PATHWAY 2 1 3 4 10
6
SERVER 71 71 65 69 276
7
TRANSIENT 5 5
8
OTHER 21 21 17 18 77
-------- --- --- --- --- ----
TOTAL 178 176 140 150 644
2
OVERVIEW Busy Distribution Analysis - Percent Cpu Busy
Class Cpu Cpu Cpu Cpu Tot
Name #00 #01 #02 #03 Pct
-------- --- --- --- --- ----
SYSTEM 18 10 39 13 80
SUBSYS 0
PATHWAY 8 4 8 12 32
SERVER 33 29 21 32 115
TRANSIENT
OTHER 0
-------- --- --- --- --- ----
TOTAL 62 44 69 58 233
9