
GPA Manual for G-series RVUs


Guardian Performance Analyzer (GPA) Manual – (544977-001) Page 53 of 106
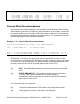
Example 3-15. Expected System Performance After Tuning
ESTIMATED PERFORMANCE PROFILE AFTER TUNING CHANGES.
CPU PROCESSOR LOAD BALANCE CHART
NUM
--- ROUNDED TO NEAREST TWO PERCENT (2%)
|----+----+----wwww^wwww-+----+----+----+----+----|
0 |+++----------> ^
1 |+++++++++---------^--------->
2 |+++----------> ^
3 |++++------------> ^
|----+----+----wwww^wwww-+----+----+----+----+----|
0 1 2 3 4 5 6 7 8 9 1
0 0 0 0 0 0 0 0 0 0
0
CPU PERCENT BUSY -------------------------------->
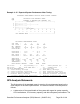
PROCESSOR PERFORMANCE CHART
CPU NUM : 0 1 2 3
CPU TYPE : TXP TXP TXP TXP
MB MEMORY: 8 8 8 8
PCT BUSY% : 28.66 58.87 30.34 34.89
DISK PRIME : 2 3 2 2
DISK RATE : 11.8 .1 11.5 1.7
CHIT RATE : 16.9 11.7
MSG RATE : 111 197 69 77
DISP RATE : 280.6 416.9 225.7 229.1
SWAP RATE : .01 .02 .02 .04
MMGR PAGES : 1555 1310 749 997
PCB COUNT : 88 77 80 87
TRANSIENTS : 5 3 3 8
HALT IMPACT: MEMORY NONE NONE NONE
CPU Count: 4 Avg CPU Busy (^): 38.1 Tuning Window (w): 8
PCB Count: 332 Node SWAP Rate : .09 VOLUME Count : 9
CPU FLAG EXPLANATIONS: + - Interrupt Busy
M - Severe Memory Shortage m - Mild Memory Shortage
P - Severe Transient Processing p - Mild Transient Processing
B - Severe Transients/Memory Shortage b - Mild Transients/Mem. Shortage
Q - Moderate Memory Shortage R - Moderate Transient Processing
! - Processor MISSING From Measurement S - Moderate Transients/Mem. Short
GPA Analysis Statements
The final section of the standard report is a series of text statements based on the
GPA analysis of the node’s performance. The section consists of several parts as
follows:
• A discussion of the overall health of the system with regard to system capacity,
CPU load balance, CPU memory capacity, and disk subsystem performance. The