
GPA Manual for G-series RVUs


Guardian Performance Analyzer (GPA) Manual – (544977-001) Page 73 of 106
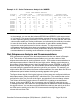
The Disk Subprocess Analysis also gives you insight into the type of disk activity that is
occurring on each volume. For example, you can see that the first PIN on $DATA has a
very high net message rate, yet its second PIN is only moderately high. This shows that
the first PIN is able to handle many I/O requests, and that these requests, on average,
are relatively inexpensive. $AUDIT contrasts with $DATA in that its second PIN is
handling more messages than its first.
Example 4-16. Disk Subprocess Analysis and Recommendations
DISK SUBPROCESS ANALYSIS AND RECOMMENDATIONS
Logical DP PIN#1 PIN#2 PIN#3 PIN#4 PIN#5 PIN#6 PIN#7 PIN#8 NC NP
Disk II Net Net Net Net Net Net Net Net EH EI
Volume SN Msg Msg Msg Msg Msg Msg Msg Msg TN WN
Name KS Rate Rate Rate Rate Rate Rate Rate Rate G S
-------- -- ------ ------ ------ ------ ------ ------ ------ ----- -- --
$AUDIT 4 5.960 8.370 2.530 .390 4
$DATA 3 53.180 4.050 3.150 +1 4
$DATA1 3 .410 -1 2
$SYSTEM 3 2.100 .910 .160 3
$V80A1 3 10.450 .510 .020 3
$V80A2 3 2.730 .070 -1 2
$V80A3 3 11.640 1.770 .190 3
$V80A4 3 17.140 1.300 .120 3
Processor/Disk Configuration Diagram
The processor/disk configuration diagram represents the physical configuration of the
system and lets you see quickly how the disk processing load is distributed over the
node (Example 4-17 AND Example 4-18).
In the examples for \NODEA and \NODEB, you can see immediately that CPUs 0 and
2, as the primary processors for all volumes on the node, are carrying virtually the
entire load on each system. And in case of \NODEA (Example 4-17), the diagram
shows a severe memory shortage for CPU 0.
Example 4-17. Processor/Disk Configuration Diagram for \NODEA
PROCESSOR/DISK CONFIGURATION DIAGRAM
CPU 0 1 2 3
TYPE TXP TXP TNSII TNSII
BUSY 34.1 66.0 32.7 11.9
FREE 8 PG 58 PG 513 PG 1475 PG
GMS110.03.003>01 GMS110.03.003>03