
GPA Manual for G-series RVUs


Guardian Performance Analyzer (GPA) Manual – (544977-001) Page 74 of 106
$SYSTEM $NSMS
7.2/ 824/ 13 14.7/ 1225/ 5
$ClO $PROJEC
2.6/ 227/ 4 6.3/ 257/ 1
$DRIVER $XPRESS
0.8/ 188/ 1 1.7/ 295/ 1
$B40 $MEAS
0.1/ 84/ 0 0.5/ 209/ 0
$X42
0.5/ 211/ 0
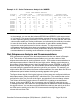
You can also readily tell from the diagram what portion of any given processor’s total
activity is accounted for by each volume on the processor. In the case of \NODEB, for
example, it is easy to see that volumes $PROD4 and $PROD3, with Disk Cache Calls
request rates of 14 and 9, account for the Disk most activity on their respective
processors.
The configuration diagram also shows the backup path for each volume. In the
example, you can see the direction of the arrowheads that all the volumes with CPU 0
as the primary processor are backed up on CPU 1 and all volumes with CPU 2 as
primary are backed up on CPU 3.
Example 4-18. Processor/Disk Configuration Diagram for \NODEB
PROCESSOR/DISK CONFIGURATION DIAGRAM
CPU 0 1 2 3
TYPE TXP TXP TXP TXP
BUSY 45.5 43.6 36.6 26.9
FREE 1715 PG 650 PG 625 PG 1087 PG
GMS110.03.003>01 GMS110.03.003>03
$SYSTEM $PROD3
9.2/ 324/ 2 6.9/ 203/ 9
GMS111.02.001>01 $TEST3
$PRODl 0.8/ 102/ 2
4.5/ 219/ 3
GMS111.02.002>03
$PROD4 $PROD5
9.7/ 89/ 14 1.1/ 278/ 1
$TESTl $PROD2
0.2/ 124/ 0 0.3/ 106/ 0
$TEST2
0.0/ 105/ 0