
GPA Manual for G-series RVUs


Guardian Performance Analyzer (GPA) Manual – (544977-001) Page 77 of 106
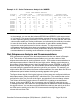
Example 4-21. Disk Volume Performance Analysis for \NODEB After Primary
Changes
DISK VOLUME PERFORMANCE ANALYSIS
VOLUME UNT CPU(S) CTL REQUEST AVG PROCESS REQUEST CACHE CACHE
NAME NOS NUM QUEUE DEVICE BUSY% RATE HIT CALLS PER
P:M PC:BC TIME BUSY% /SECOND RATE% REQUEST
-------- --- ----- --- ------- ------ ------- ------- ----- ---------
$AUDIT 0:1 0: 1 %12 14.41 34.40 4.05 28.12
$DATA 2:3 0: 1 %10 4.35 15.55 5.41 67.44 99.4 .2
$DATA1 2:3 0: 1 %12 21.31 0.83 0.07 0.03 1.0
$SYSTEM 0:1 0: 1 %10 13.79 4.71 0.62 4.79 94.2 .9
$V80A1 0: 3: 2 %30 6.23 5.23 1.89 11.21 91.8 1.9
$V80A2 1: 3: 2 %30 12.21 3.02 0.48 2.09 71.9 1.5
$V80A3 2: 2: 3 %32 9.53 9.29 3.72 15.54 90.0 1.5
$V80A4 3: 2: 3 %32 5.51 7.20 2.86 19.21 90.7 1.4
$XL80A1 0:1 2: 3 %10 13.33 16.13 3.72 12.25 92.6 2.7
$XL80A2 2:3 2: 3 %10 20.29 17.59 2.78 7.52 87.0 2.7
$XL80A3 0:1 2: 3 %12 23.45 14.04 1.96 4.40 84.2 2.7
$XL80A4 2:3 2: 3 %12 19.44 14.63 2.50 6.03 86.8 2.8
$XL80B1 0:1 1: 2 %10 18.42 20.71 3.39 11.43 86.0 2.2
$XL80B2 2:3 1: 2 %10 15.19 18.51 3.04 12.96 85.8 1.9
$XL80B3 0:1 2: 1 %12 17.29 16.63 2.66 9.23 85.5 2.1
$XL80B4 2:3 2: 1 %12 9.18 17.04 4.19 21.44 91.0 1.4
$XL80C1 0:1 3: 0 %10 11.31 14.79 4.20 12.00 93.2 3.0
$XL80C2 2:3 3: 0 %10 9.17 12.32 2.89 10.43 92.9 3.0
$XL80C3 0:1 0: 3 %12 15.51 10.52 1.96 5.94 90.5 3.5*
$XL80C4 2:3 0: 3 %12 15.18 11.01 2.06 4.33 88.8 3.0
$XL80D1 4:5 0: 3 %30 0.00 1.21 0.01 0.00 1.0
$XL80D2 6:7 3: 0 %30 4.03 1.29 0.05 0.00 18.2*
$XL80D3 0:1 3: 0 %32 3.25 1.27 0.06 0.00 5.5*
$XL80D4 2:3 3: 0 %32 4.01 1.25 0.06 0.00 3.2*
$XL80E1 0:1 2: 1 %30 18.37 20.34 3.27 11.23 86.9 2.3
$XL80E2 2:3 2: 1 %30 21.44 16.78 2.45 6.05 85.1 2.8
$XL80E3 0:1 1: 2 %32 11.92 8.55 1.89 5.56 90.7 2.9
$XL80E4 2:3 1: 2 %32 14.30 12.03 2.37 6.04 90.5 3.1*
In the Disk Volume Performance Analysis (Example 4-21) under the CPU(S) column,
volumes $XL80B1 and $XL80B2 show the primary and backup processor as CPU 1
and CPU 2 respectively. Before the primary change, the location of the primary and the
backup processes were reversed. The asterisks after the number of cache calls per
request call your attention to levels greater than 3.1, and are considered by GPA to be
excessive. Files with index levels greater than 2 and large block writes (for example,
writes to an audit file) often contribute to this threshold being exceeded.
The Processor/Disk Configuration Diagram also changes. By comparing Example 4-22
with Example 4-23 you can see that the primary disk process, $XL80B1 and $XL80B2,
on CPU2 have been moved to CPU1.
Example 4-22. Processor/Disk Configuration Diagram for \NODEC Before Primary
Changes
PROCESSOR/DISK CONFIGURATION DIAGRAM
CPU 0 1 2 3
TYPE CYCLON CYCLON CYCLON CYCLON