Guardian Performance Analyzer (GPA) User Guide Abstract GPA consolidates, analyzes and reports system performance data collected by Measure, the HP NonStop™ system performance measuring product. On the basis of the GPA analysis logic, GPA reports how well or how poorly the system is performing and makes recommendations for improving the overall performance of the system. Product Version H02ABM & D40ABK Supported Release Version Updates (RVUs) This publication supports G06.25, H06.10 and J06.
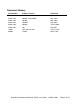
Document History Part Number Product Version Published 544541-006 H02ABM and D40ABK April, 2011 544541-005 H02ABL and D40ABK April, 2010 544541-004 H02ABJ May, 2009 544541-003 H02ABH May, 2008 544541-002 H02ABF January 2008 544541-001 H01 May 2007 135081 GPA D00 and G00 January 1998 089503 C30.
Table of Contents Guardian Performance Analyzer (GPA) User Guide ................................................. 1 Abstract ................................................................................................................................. 1 Product Version ..................................................................................................................... 1 Supported Release Version Updates (RVUs) ........................................................................
Section 2: Running GPA ........................................................................................... 30 An Overview of the GPA Procedure ........................................................................................ 30 Establishing the Measurement Period ................................................................................. 31 Running Measure ................................................................................................................
Disk Subprocess Analysis and Recommendations .............................................................. 61 Processor/Disk Configuration Diagram ................................................................................ 63 IPC Traffic Analysis ............................................................................................................. 65 Process Move Recommendations .......................................................................................
The Detail System Performance Score Reports .................................................................... 115 Negative Contributing Factors to CPU Score .................................................................... 116 Negative Contributing Factors to Memory Subsystem Score ............................................ 117 Disk Cache Performance Score Grading ........................................................................... 118 Negative Contributing Factors to Disk Volume Score ......
List of Figures and Tables Figure 1-1 How GPA works ................................................................................................ 22 Figure 2-1. GPA Analysis and Tuning Procedure ............................................................... 30 Figure 2-2. Code Characters in a GPA Text Statement Paragraph .................................... 32 Example 3-1. Node Characteristics .................................................................................... 46 Example 3-2.
Example 4-4. Global Performance Indicators for \NODEA ................................................. 80 Example 4-5. Global Performance Indicators for \NODEB ................................................. 81 Example 4-6. Global Performance Indicators for \NODEC ................................................. 81 Example 4-7. Disk Volume Performance for \NODEA ........................................................ 82 Example 4-8. System Performance Indicators for \NODEA .............................
Example 4-30. Summary Section for the System Class for \NODEC ............................... 109 Example 4-31. Additional Information in the Detail Section for the System Class for \NODEC ...................................................................................................................... 110 Example 4-32. Summary Section for the Server Class for \NODEC................................. 111 Example 4-33. Busy and Send Portions of the Detail Section for the Server Class for \NODEC ..........
What’s New in This Manual New and Changed Information The H02ABM version of GPA includes the following significant changes; 1. This manual has been updated to reflect maintenance release H02ABM. 2. Clarification added to process of running GPA.
About This Manual This manual describes the Guardian Performance Analyzer (GPA) and tells you how to install and use it on a NonStop system. The manual is intended mainly for system performance analysts, system managers, and others responsible for the performance of NonStop systems. We assume in this manual that you are familiar with the Guardian operating system and with Measure, the NonStop system performance measuring product.
Notation Conventions Hypertext Links Blue underline is used to indicate a hypertext link within text. By clicking a passage of text with a blue underline, you are taken to the location described. For example: This subsection discusses the various sections of the GPA Standard Report described in Section 3: Description of GPA Reports. General Syntax Notation This list summarizes the notation conventions for syntax presentation in this manual.
INT[ERRUPTS] A group of items enclosed in brackets is a list from which you can choose one item or none. The items in the list can be arranged either vertically, with aligned brackets on each side of the list, or horizontally, enclosed in a pair of brackets and separated by vertical lines. For example: FC [ num ] [ -num ] [ text ] K [ X | D ] address { } Braces A group of items enclosed in braces is a list from which you are required to choose one item.
LISTOPENS SU $process-name.#su-name Quotation marks around a symbol such as a bracket or brace indicate the symbol is a required character that you must type as shown. For example: "[" repetition-constant-list "]" Item Spacing Spaces shown between items are required unless one of the items is a punctuation symbol such as a parenthesis or a comma. For example: CALL STEPMOM ( process-id ) ; If there is no space between two items, spaces are not permitted.
error := FILENAME_COMPARE_ ( filename1:length , filename2:length ) ; !i:i !i:i !o:i In procedure calls, the !o:i notation follows an output buffer parameter that has a corresponding input parameter specifying the maximum length of the output buffer in bytes.
Notation for Messages This list summarizes the notation conventions for the presentation of displayed messages in this manual. Bold Text Bold text in an example indicates user input typed at the terminal. For example: ENTER RUN CODE ?123 CODE RECEIVED: 123.00 The user must press the Return key after typing the input. Nonitalic text Nonitalic letters, numbers, and punctuation indicate text that is displayed or returned exactly as shown. For example: Backup Up.
obj-type obj-name state changed to state, caused by { Object | Operator | Service } process-name State changed from old-objstate to objstate { Operator Request. } { Unknown. } | Vertical Line A vertical line separates alternatives in a horizontal list that is enclosed in brackets or braces. For example: Transfer status: { OK | Failed } % Percent Sign A percent sign precedes a number that is not in decimal notation. The % notation precedes an octal number. The %B notation precedes a binary number.
Notation for Management Programming Interfaces This list summarizes the notation conventions used in the boxed descriptions of programmatic commands, event messages, and error lists in this manual. UPPERCASE LETTERS Uppercase letters indicate names from definition files. Type these names exactly as shown. For example: ZCOM-TKN-SUBJ-SERV lowercase letters Words in lowercase letters are words that are part of the notation, including Data Definition Language (DDL) keywords.
Section 1: Introducing GPA The Guardian Performance Analyzer (GPA) is a software tool designed specifically for use by system performance analysts, system operations managers, or other persons responsible for the proper performance of a NonStop system. GPA consolidates and analyzes system performance data collected by Measure, the NonStop system performance measuring product.
GPA Benefits and Features Among the user benefits offered by GPA are the following: Enables the performance analyst to become familiar with a system quickly. Substantially shortens the time needed to analyze the system‟s performance. Helps the performance analyst to identify performance problem areas and, in many cases, to pinpoint the specific causes of such problems. Allows the system manager to determine quickly the effectiveness of system performance management.
How GPA Works GPA bases its analysis on system performance data collected by Measure and on the GPA internal model of a NonStop system multiprocessor node. As distributed, GPA consists of these files: GPAGOBJ or GPAHOBJ is the foundation process or wrapper which performs the initialization, multiple node license check, handling different Measure versions, creation of the entity files for GPA analysis then programmatically calling the proper GPA module for processing (e.g. GPAG or GPAH).
Figure 1-1 How GPA works Figure1-1 Illustrates the GPA analysis process and shows the relationship of MEASURE, MEASFH, and the various GPA components. Measure Collection MEASURE MEASFH OBEYTUNE LicPfile LicSfile GPAGOBJ GPAHOBJ Exclude Global Tunedata GPAH Analysis Reports (Via Spooler or File) GPAG GPALOG (Error Log) PUPIN SCFIN ---------------PUPBAK SCFBAK The GPA module is essentially a model of a NonStop system node.
whole and also separately analyzes each subsystem with respect to a number of relevant performance parameters such as CPU utilization, disk volume queuing, cache hit percentage, and so on. The module processes the formatted data files in accordance with the model and uses the text formats contained in the TUNEDATA file to generate the GPA standard textual reports. (Note: GPAG is used on G versions of Guardian OS, and GPAH is used on H & J versions of Guardian OS.
Standard Report Sections The GPA standard report provides performance analysis data and evaluations for the system under study. The report consists of the following major sections: System Performance Summary: A concise presentation of system performance data and evaluation of overall system health. Process and Busy Distribution Analyses: A concise presentation of the number, location, and CPU utilization of processes within the system.
Optional Report Sections In the GPA Optional Report, you specify the level of additional detailed information to be provided. You choose the type of output you want for each report section. Three output types are available: Noprint: Skip this optional report section. Summary: A breakdown of the number of processes in each CPU for each of the following reports (each of which is a class of process).
Error Reports The GPALOG.101 file informs you of system errors and diagnoses them. Two types of errors can occur: Fatal errors that cause GPA to terminate. Non-fatal errors, on which GPA bases its performance-enhancing recommendations.
Exclude File The exclude file (EXCLUDE.101) is used to specify processes and/or CPUs that will be excluded from consideration in the tuning/balancing logic used for the recommendation section of the GPA Report. The entry format of the exclude file is keyword [value,]… Valid keywords include CPUTO, CPUFROM and PROGRAM. Valid values depend on the keyword and include: For CPUTO, CPUFROM: 0-15. Multiple CPUs should be comma-separated. For PROGRAM: Guardian external file name ($vol.subvol.fn), 1 per line.
File Specifications The following files will be installed within your GPA subvolume and recommend file security setting of “NUNU”. File Name Description EXCLUDE.101 Contains directives which define which CPUs and processes that will be excluded in GPA‟s performance recommendations. GLOBAL.101 Contains various processor performance attribute variables which are loaded at runtime. (Note: This file may require to be updated from time to time as new processor (i.e. CPU Type/Subtype) are released.) GPAG.
GPA Requirements GPA does not have to be run on the system being analyzed; the Measure data can be moved to another NonStop system. GPA requires the use of the following NonStop system products: Item NonStop system Product Number Measure* T9086 (Version is RVU dependent) * Must be installed on the system being analyzed. GPA licensing considerations: GPA needs to be registered for each NonStop node that will be passing Measure data to GPA.
Section 2: Running GPA This section begins with an overview of the procedure for running GPA, followed by detailed information about the procedure. We strongly recommend that you read through the overview section before you attempt to install or run GPA for the first time. Note that using GPA also involves the use of the Measure performance-tool. The GPA procedure in this section includes the high-level steps for using Measure in conjunction with GPA.
Establishing the Measurement Period The purpose of this step is to establish the length of the following two time periods for running Measure: The measurement window: This is the total duration of a single Measure run that collects performance data for the system. The data collection interval: This is the length of each time period within the measurement window for which Measure collects and reports the data.
Running Measure In this step, you run Measure to collect performance data for the system. When you run Measure, you specify the measurement window and data collection interval that you established in the previous step. (Refer to the Measure User‟s Guide for more information on using this product.) Determining the Analysis Period The object of this step is to examine the data collected with Measure in the preceding step to determine the most appropriate period of system use for GPA to analyze.
Running GPA Normally GPA does not require specific installation. It is installed as part of an RVU install process and will be installed in the $SYSTEM.ZGPA subvol. To run GPA, you simply set your current volume to the subvol location of GPA, modify the OBEYTUNE file params to point to the Measure collection to be processed and set the various other runtime options then run (i.e. obey) OBEYTUNE.
Tuning the System with PUPIN or SCFIN In this final step of the procedure, you implement some of the GPA tuning recommendations by running a PUP INPUT file, PUPIN, or an SCF INPUT file, SCFIN, which GPA generates as part of its analysis. PUPIN/SCFIN contains commands for redistributing primary disk process paths and resetting disk volume cache allocations. (If you want to restore the system to its previous condition after you run PUPIN/SCFIN, you can do so with another PUP or SCF INPUT file, PUPBAK/SCFBAK.
The GPA Pre-Requisites 1. Establish the measurement window and data collection interval for running Measure on the system, as described earlier. 2. Use the STATUS command to see if the Measure subsystem is currently running. If it is, go directly to Step 3. Otherwise, start the Measure subsystem by entering: 1> MEASCOM When the MEASCOM prompt (+) appears, enter: + START MEASSUBSYS Note You must be logged on as a super group user to invoke the START MEASSUBSYS command.
where: measfile is the fully qualified file name you give to the measurement data file. xx:xx is the time in hours and minutes (on the 24-hour clock) at which you want the measurement to begin. yy:yy is the time at which you want the measurement to end. h is the length in hours of the measurement interval. Example The following command begins the measurement at 9:00 AM, ends the measurement at 5:00 PM, specifies a one-hour data collection interval, and collects the data in the file $PERF.DATA.
4> MEASCOM When the MEASCOM prompt appears, enter the following commands line by line: + ADD MEASUREMENT file-name + LIST CPU * + ADD PLOT CPU-BUSY-TIME + LIST PLOT The plot that Measure displays shows the busy time for each CPU on the node at each of the specified measurement intervals over the entire measurement period. (For a detailed discussion of Measure plots, see the Measure User’s Guide.) b. From the Measure plot, determine the busiest one- to three-hour period for the system.
The GPA Runtime Parameters The following is a list of parameters in the "OBEYTUNE.101" file. Please note that all parameters are not required and should be commented out or removed, if not needed. Also if one of the optional PROCESS-WINDOW… parameters is defined, all the PROCESS-WINDOW… parameters become mandatory. PARAM FORCE-LOW-PRIORITY {no | ####} (Optional) This parameter is used to set the runtime priority of GPA. Valid values are "NO" or 3 digit priority value.
Important note: The following 4 PROCESS-WINDOW params are dependent and if used then all 4 params must be included. PARAM PROCESS-WINDOW-FROM-YYYYMMDD {yyyymmdd} (Optional) Where: yyyy = Year, mm = Month and dd = Day This parameter is used to define the 'from' or 'start' date within the Measure collection data to use for the GPA analysis. If omitted, entire collection is processed (note dependency).
Important note: As of versions ABK/ABL the following 4 MEASURE-FILE params need to point to the Measure collection which contains the corresponding entity that matches the param suffix (e.g. FILE-CPU must point the Measure collection containing the CPU entity, etc.). If all entities are in a single collection then all will have the same collection file name, otherwise they can be different if using multiple collections as input to GPA.
7> PARAM classname section-type classname specifies the process class the optional report is run for. The classnames are: SYSTEM SUBSYSTEM PATHWAY SERVER TRANSIENT OTHER You can select more than one section for the optional report by setting one PARAM for each class. Section-type specifies the type of output GPA should produce. The options are: SUMMARY DETAIL An optional section is run for each of the PARAMs declared.
PUPIN and PUPBAK or SCFIN and SCFBAK files. You can direct the reports to a printer or file depending upon the settings of the following Params: SEND-OUTPUT-TO-SPOOLER, REPORT-FILE, OPTIONAL-FILE If directed to the spooler then the standard and optional reports will appear as separate files in the spooler. 4. To implement the GPA tuning recommendations (primary disk process and cache block reallocations) in the PUPIN/SCFIN file, enter: 17> PUP /IN PUPIN/ or 17> SCF /IN SCFIN/ 5.
Section 3: Description of GPA Reports Overview of GPA Reports GPA reports include standard reports and optional reports. These reports are listed briefly below and then described in detail.
Note This applies only to the process class optional reports: SYSTEM, SERVER, SUBSYSTEM, TRANSIENT, PATHWAY, and OTHER. The rest of the optional reports are described in Section 4: Using GPA Information. When you specify the summary option, you receive the Process Distribution Analysis for the class. When you specify the detail option, you receive all five sections. The optional report enables you to perform several more detailed analyses than the standard report does.
GPA Standard Report The following information describes in detail each of the entries in each of the sections of the GPA Standard Report. Examples 3-1 through 3-15 show the sections of a typical report. The items within each report section that are discussed below are identified in the text by numbers in parentheses and by corresponding boldface numbers in the figures.
Node Characteristics This subsection of the report (Example 3-1) gives general performance figures for the node GPA has analyzed. For each line item in this subsection, the report shows a measured value and, where it applies, the maximum value the GPA model expects. Example 3-1. Node Characteristics I.
(6) DYNAMIC PCBS: The number of dynamic process control blocks on the node. This figure represents processes that were started and stopped during the measurement period analyzed by GPA. (These processes are also known as transients). (7) OUT OF BALANCE CPU COUNT: The number of processors on the node that GPA has found to be relatively over- or underutilized, hence out of balance. (8) MOST BUSY CPU: The most utilized processor on the node, that is, the one with the highest percentage busy time.
Disk Volume Performance This subsection of the report (Example 3-2) is a table that indicates the extremes in disk volume performance for the node. The format is such that the differences in high and low values can easily be seen as an indication of system performance. Example 3-2. Disk Volume Performance I I. DISK VOLUME PERFORMANCE VOLUME BUSY% REQUEST CPU QTIME (s) 1 LOW BUSY DISK VOL : $X42 .0 0 2: 3 2 HI BUSY DISK VOL : $SYSTEM 18.9 25 0: 1 3 LOW Q-TIME VOL : $ClO 4.
Global Performance Indicators In this subsection of the report (Example 3-3), GPA provides an overall evaluation of the system‟s performance based on the GPA analysis criteria. For the node in the example, the GPA analysis has found the following conditions: Example 3-3. Global Performance Indicators III. GLOBAL PERFORMANCE INDICATORS 1 3 5 7 9 11 EXCESSIVE DISPATCHING PROCESSOR LOAD BALANCE OVER UTILIZED NODE OVER UTILIZED CPU DISK VOLUME QUEUING AVERAGE CACHE HIT % : : : : : : NO POOR NO NO YES 83.
(7) OVER UTILIZED CPU: No over utilization of any processors. None of the percentage busy times for the CPUs on the node was found to be excessive. (8) TRANSIENT PROCESSING: No excessive transient processing. The number of dynamic PCBs on the node (see Example 3-1) is not excessive. (9) DISK VOLUME QUEUING: Excessive disk volume queuing. The request queue time for one or more disk volumes on the node is too high. (10) BLOCKED REQUESTS: No blocked requests.
System Performance Score This subsection of the report (Example 3-4) rates the performance of the node and its subsystems from 0 to 100%, with a score of 100% being best. Note that these scores are not absolute values. They merely indicate the quality of performance of the subsystems and show which of the subsystems might profit from corresponding tuning changes. The system recovery performance score indicates how well the system would be able to continue performing if any of the processors were to fail.
Process and Busy Distribution Analyses The Process and Busy Distribution Analyses section of the report (Example 3-5) is broken into two parts, which give you an overview of how the system is being utilized by class of process and by CPU. Example 3-5.
(3) SYSTEM: The SYSTEM class consists of processes that are part of the OSIMAGE or have an execution priority greater than 199. (4) SUBSYS: The SUBSYSTEM class consists of processes that are part of the system image subvolume, $SYSTEM.SYSnn.*, and are not TRANSIENT. (5) PATHWAY: The PATHWAY class consists of processes with the filename PATHMON or PATHTCP2, and are not TRANSIENT.
Processor Load Balance and Performance Charts This section of the report consists of two charts: the Processor Load Balance Chart and the Processor Performance Chart. Processor Load Balance Chart This chart (Example 3-6) shows graphically how the system load is distributed among the node‟s processors. Each CPU‟s percentage busy is shown in the area between the two horizontal scale lines. The plus (+) signs indicate graphically the proportion of the CPU busy time spent doing interrupt processing.
PROCESSOR PERFORMANCE CHART 1 2 3 4 5 6 7 8 9 10 11 12 13 14 CPU CPU MB PCT DISK NUM : TYPE : MEMORY: BUSY : PRIME : DISK CHIT MSG DISP RATE RATE RATE RATE 0 TXP 8 45.54 5 : : : : 11.9 16.9 197 456.9 SWAP RATE : .01 MMGR PAGES : 1715 PCB COUNT : 84 TRANSIENTS : 5 HALT IMPACT: MEMORY 15 1 TXP 8 43.63 0 2 TXP 8 36.66 4 93 240.6 13.3 11.7 77 242.1 .02 650 87 3 NONE .02 .04 625 1087 77 84 3 8 NONE NONE 16 CPU Count: PCB Count: 18 4 332 3 TXP 8 26.
Processor Performance Chart This chart (Example 3-6) gives the following physical and performance data for each processor on the node analyzed: (1) CPU NUM: The processor‟s identification number. (2) CPU TYPE: The processor‟s type designation. All of the processors in the example are TXPs. (3) MB MEMORY: The processor‟s total memory in megabytes. Each processor on this node has 8 megabytes of memory. (4) PCT BUSY: Percentage of time the processor is busy.
(14) HALT IMPACT: How system performance would be affected if the processor failed. Notice in the example that the failure of CPU 0 would result in a significant shortage of available memory on the other processors. The Processor Performance Chart also provides the following summary data for the entire node: (15) CPU Count: The total number of processors. (16) Avg CPU Busy (^): The average of the percentage busy time for all processors.
Disk Volume Performance Analysis This section of the report (Example 3-7) provides the following items of information for each disk volume in the system: Example 3-7. Disk Volume Performance Analysis DISK 1 VOLUME 2 VOLUME NAME 3 UNT CPU(S) NOS P:M PC:BC -------- --- ----$SYSTEM 0:1 0: 1 $NSMS 0:1 2: 3 $ClO 2:3 0: 1 $PROJEC 2: 2: 3 $DRIVER 4: 0: 1 $XPRESS 3: 2: 3 $MEAS 4:5 2: 3 $B40 5: 0: 1 $X42 6: 2: 3 PERFORMANCE 4 CTL NUM --%01 %01 %01 %01 %01 %01 %01 %01 %01 5 REQUEST QUEUE TIME ------25.11 24.
(10) CACHE CALLS PER REQUEST: The average number of cache calls used to satisfy a request. An asterisk (*) after this value indicates that greater than 3.1 cache calls per request occurred on the particular volume. This is considered excessive by GPA and should be investigated.
Cache Performance Analysis This section of the report (Example 3-9) is a table that shows cache block data for each of the disk volumes in the system. For each volume, the table gives information for each size of cache block (512 bytes, 1024 bytes, 2048 bytes, and 4096 bytes): Example 3-9.
Disk Subprocess Analysis and Recommendations Disk Subprocess Analysis and Recommendations (Example 3-10a) is a summary of the disk subprocesses associated with each logical disk volume in the system. Example 3-10a. Disk Subprocess Analysis and Recommendations DISK SUBPROCESS ANALYSIS AND RECOMMENDATIONS RATING CRITERIA: GOOD (AQL < 1.0); FAIR (1.0 <= AQL <= 3.0); POOR (AQL > 3.
(9) RATE: The rate is assigned based on the REQ QTIME AQL value. i. GOOD: AQL < 1.0 ii. FAIR: 1.0 <= AQL <= 3.0 iii. POOR: AQL > 3.0 (10) RCM CHG: The recommended change, if possible, to the number of disk subprocesses for the logical volume. SCF may be used to make the change. (11) RCM NEW PIN CNFG: The recommended new total number of PINS. This analysis considers the REQ QTIME AQL (Average Queue Length). Based on this value, it recommends adding disk subprocesses, if available.
Processor/Disk Configuration Diagram The following diagram (Example 3-10b) shows system information in a form that represents the system‟s physical configuration. The layout of the diagram gives a quick overview of how the disk processing load is distributed over the system. Please note that if server contains more than eight CPUs the report will be split in two from 0-7 and 8-15. Example 3-10b.
The below information is data for each disk volume for which the processor is the primary CPU, including: (9) The name of the volume. (10) The percentage busy time for the disk processes associated with the volume, followed after the first slash (/) by the number of memory pages held by the disk process, and followed after the second slash (/) by the number of cache calls per second for the volume. (11) GMS information with an arrowhead pointing toward the CPU number of the backup DP2 process.
IPC Traffic Analysis For ServerNet-based systems, there is one IPC Traffic Analysis report (Example 3-11) for each CPU in the system, which provides a summary of IPC (Inter-Processor Communication) traffic to and from each processor. To generate this report, you enter the following commands at the MEASCOM prompt before you run GPA.
IPC activity (“From Number”). (4) TO NO: The number of the listener CPU, which is the replying or receiving processor of IPC activity (“To Number”). (5) Read KReqs: The number of requests, in thousands, that transferred data from this entity to the processor. (6) Read KBytes: The total number of kilobytes transferred as a result of read requests. (7) Rsecs Qtime: The total time spent by read requests queued for this entity, in seconds.
Process Move Recommendations This section of the report (Example 3-13) contains recommendations, based on the GPA analysis of the node, for improving the performance of the system. It tells what processes could be moved to other CPUs on the node to achieve a more balanced load distribution and better utilization of existing memory. You implement the moves that are appropriate for your particular situation. Example 3-13.
Expected System Performance After Tuning This section of the report (Example 3-14) contains Processor Load Balance and Performance Charts, the same two types of charts as those described earlier. Here, the data show what the system conditions would be if all of the GPA tuning recommendations were followed. Example 3-14. Expected System Performance After Tuning ESTIMATED PERFORMANCE PROFILE AFTER TUNING CHANGES.
Q - Moderate Memory Shortage ! - Processor MISSING From Measurement R - Moderate Transient Processing S - Moderate Transients/Mem. Short GPA Analysis Statements The final section of the standard report is a series of text statements based on the GPA analysis of the node‟s performance. The section consists of several parts as follows: A discussion of the overall health of the system with regard to system capacity, CPU load balance, CPU memory capacity, and disk subsystem performance.
GPA Optional Report When you select at least one section of the GPA Optional Report, a page at the beginning of the report summarizes your selections. (See Exclude File description for instructions on how to setup exclusions). Example 3-15 is an example. Example 3- 15.
(1) Optional Report Exclude Parameter Values: The list of CPUs to be excluded as a recipient (TO CPU) or a contributor (FROM CPU) and the list of programs (PROGRAM) to be excluded from the recommendation process. These values get provided in the EXCLUDE.101 file referenced by the OBEYTUNE.101 command file. (2) Parameter Name: The parameter name describes the process classes. An asterisk (*) also describes the process classes.
Summary Section Choosing the summary option produces a table describing the distribution of programs or process names within the class by count. In the case of the SYSTEM class, the section describes the activity of process names, while for all other classes, the section describes the activity of programs. GPA handles classes differently because all the processes in the SYSTEM class are contained in the single object file, OSIMAGE.
(3) (4) User-configured processes in the SYSTEM class are collapsed into a common name space to help make the section more readable. The question mark (?) character means any single character may replace it. For example, the user-configured process $TAP?? could include the process names $TAP01, $TAP02, $TAP23, and $TAPZZ. The operating system image number that was assigned at the last SYSGEN is also shown in this section. In this case, its location is $SYSTEM.SYS20.OSIMAGE.
Detail Section Example 3-17 is an example of the additional information provided by GPA when you select the detail option for the SYSTEM class. Example 3-17.
VIRTUAL TMP Z0 MSENGER UnNamed -------TOTALS 4 4 1 1 1 --- --- --- --45 11 32 10 4 4 1 1 1 ---99 5 (1) Busy Distribution Analysis: The Busy Distribution Analysis gives a breakdown in descending order of each process name‟s CPU utilization. Note that the percentages total 99% so that the percentages are within the class, and are not for the total system. (2) Send Distribution Analysis: The Send Distribution Analysis is a breakdown by process name of the percentage of total messages sent by the class.
Section 4: Using GPA Information Interpreting the Standard Report A GPA analysis can detect and point to a number of causes of poor or inefficient system performance. For some of the problems, such as a memory shortage or a load imbalance, GPA can make appropriate tuning recommendations and even, in some cases, provide the means for automatically implementing the recommendations.
Node Characteristics The Node Characteristics subsection of the GPA report for \NODEA (Example 4-1) shows the following: The node has a total of 4 processors, 32 megabytes of memory, and 9 disk volumes. There were 264 static (steady-state) processes and 11 dynamic (transient) processes on the node during the measurement period. The most utilized processor is CPU 1, the least utilized processor is CPU 3, and the average processor busy time is 36.2 percent.
Example 4-2 shows that \NODEB has characteristics that are generally similar to those of \NODEA. Example 4-2. Node Characteristics for \NODEB I. NODE CHARACTERISTICS CPU TYPE : CPU COUNT : TOTAL MEMORY : VOLUME COUNT : STATIC PCBS : DYNAMIC PCBS : OUT OF BALANCE CPU COUNT : MOST BUSY CPU : LEAST BUSY CPU : AVG CPU BUSY : AVG DISK VOLUME BUSY : AVG DISK PROCESS BUSY : % - RECOMMENDED RESOURCES: NODE SWAP RATE : MEASURED MAX VALUE VALUE EXPECTED TXP 4 32 9 332 19 1 0 3 38.1 3.4 3.9 54.5 .
You can get a picture of the overall health of the system from some of the data in the Node Characteristics subsection of the report as well as from the Global Performance Indicators. From the Node Characteristics subsection, you can tell the following: How many page swaps per second are taking place on the node (NODE SWAP RATE). This is the total of the swap rate for all CPUs. If the report shows a node swap rate greater than 1.
Figure 4-1. Response Time as a Function of CPU Utilization A rundown of the global performance indicators for \NODEA (Example 4-4) shows that the processor load balance on the system is poor and that there is excessive disk queuing. The cache performance, with an average cache hit percentage of 83.2, is also deficient. However, the overriding problem on this node is a serious shortage of memory, as indicated by the node swap rate and the memory subsystem performance score (discussed later). Example 4-4.
The global performance indicators for \NODEB (Example 4-5) show that the health of the system is generally good except for processor load balance, which GPA considers only fair, and disk volume queuing, which GPA found excessive in some cases. The disk cache performance is acceptable, although it shows potential for improvement. Example 4-5. Global Performance Indicators for \NODEB III.
Disk Volume Subsystem Performance Score You can get a further indication of where problems might lie from the Disk Volume Performance subsection of the report (Example 4-7). This section shows the high- and low-value extremes for a number of disk volume performance parameters and thus makes it easy to see whether the disk volume subsystem may be presenting difficulties. For a properly balanced system, the high and low values should be as close together as possible.
System Performance Score In the System Performance Score subsection of the report (Examples 4-8 through 4-10), you can see which parts of the system are doing most poorly and, therefore, have the greatest potential for improved performance through tuning. This section rates the relative performance of the node‟s subsystems with scores ranging from 0 to 100 percent.
Example 4-10. System Performance Indicators for \NODEC IV. SYSTEM PERFORMANCE SCORE 1. 2. 3. 4. 5. * 6. * CPU SUBSYSTEM MEMORY SUBSYSTEM DISK CACHE SUBSYSTEM DISK VOLUME SUBSYSTEM SYSTEM RECOVERY PERFORMANCE WEIGHTED ANALYSIS SYSTEM SCORE : : : : : : 76% 92% 88% 68% 52% 75% Average Score rated: BEST = 100, WORST = 0.
Process and Busy Distribution Analyses As you look at the Process and Busy Distribution Analyses for \NODEC (Example 4-11), you can see that the SYSTEM processes are fairly evenly distributed among the four processors in the system but that the distribution could be improved. You can also see a relatively large spread in the Busy Distribution for the SYSTEM class, especially between CPU 1 and CPU 2. Example 4-11 shows that moving some of the SYSTEM class‟s load from CPU 2 to CPU 1 would improve performance.
OVERVIEW Busy Distribution Analysis Class Tot Name Pct -------SYSTEM 80 SUBSYS 0 PATHWAY 32 SERVER 115 TRANSIENT 0 OTHER 0 -------TOTAL 233 Cpu Cpu Cpu Cpu - Percent Cpu Busy #00 #01 #02 #03 --- --- --- --18 10 39 13 8 4 8 12 33 29 21 32 --- --- --- --62 44 69 --- --- 58 [Back to TOC] Guardian Performance Analyzer (GPA) User Guide – (544541-006) Page 86 of 131
Processor Load Balance and Performance Charts The next major section of the GPA report (Example 4-12 and Example 4-13) contains two charts that give you a more detailed picture of the system based on the performance of the system‟s processors. The first chart shows you graphically how the system load is distributed among the processors. Abnormal conditions such as a memory shortage or excessive transient processing are also indicated here (by flags following the CPU numbers).
PCB COUNT : 86 TRANSIENTS : 4 HALT IMPACT: MEMORY 89 3 MEMORY 41 MEMORY 48 4 MEMORY CPU Count: 4 Avg CPU Busy (^): 36.2 Tuning Window (w): 8 PCB Count: 264 Node SWAP Rate : 2.36 VOLUME Count : 9 CPU FLAG EXPLANATIONS: + - Interrupt Busy M - Severe Memory Shortage m - Mild Memory Shortage P - Severe Transient Processing p - Mild Transient Processing B - Severe Transients/Memory Shortage b - Mild Transients/Mem.
Other important parameter values shown in this chart are: The page swap rate (SWAP RATE). As mentioned previously under System Performance Summary, a page swap rate greater than 1 indicates a memory shortage or overutilization of the CPU. The number of pages of memory owned by the memory manager. Refer to your SYSGEN output and note that at the end of each processor section are listed the number of pages locked and the minimum pages.
PROCESSOR PERFORMANCE CHART CPU CPU MB PCT DISK NUM : TYPE : MEMORY: BUSY : PRIME : DISK CHIT MSG DISP RATE RATE RATE RATE : : : : 0 TXP 8 45.54 5 11.9 16.9 197 456.9 SWAP RATE : .01 MMGR PAGES : 1715 PCB COUNT : 84 TRANSIENTS : 5 HALT IMPACT: MEMORY 1 TXP 8 43.63 0 2 TXP 8 36.66 4 3 TXP 8 26.93 0 93 240.6 13.3 11.7 77 242.1 .02 650 87 3 NONE .02 .04 625 1087 77 84 3 8 NONE NONE 76 212.7 CPU Count: 4 Avg CPU Busy (^): 38.1 Tuning Window (w): 8 PCB Count: 332 Node SWAP Rate : .
Disk Volume Performance Analysis To track the performance of the disk volume subsystem, you look at the Disk Volume Performance section (Example 4-14). Here you can see how the volumes are configured with respect to primary and backup CPUs as well as primary disk controllers. You can also see how the volumes compare with regard to a number of performance parameters.
Cache Performance Analysis In the Cache Performance Analysis section of the report (Example 4-15), GPA analyzes the cache performance for each disk volume on the node by the four sizes of blocks, 512, 1024, 2048, and 4096 bytes, used in the system. For each volume and each block size, the table shows the number of blocks allocated to cache, the percentage of cache hits, and the number of requests per second. Example 4-15.
Disk Subprocess Analysis and Recommendations GPA generates an analysis of the disk subprocesses like the one shown in Example 4-16. This section of the standard report enables you to see the number of disk subprocesses allocated to each logical disk volume. GPA makes recommendations to add subprocesses when it finds that they are highly active. Making actual changes to the number of disk subprocesses is done by performing a new SYSGEN or using SCF.
Processor/Disk Configuration Diagram The processor/disk configuration diagram represents the physical configuration of the system and lets you see quickly how the disk processing load is distributed over the node (Example 4-17 AND Example 4-18). In the examples for \NODEA and \NODEB, you can see immediately that CPUs 0 and 2, as the primary processors for all volumes on the node, are carrying virtually the entire load on each system.
Example 4-18. Processor/Disk Configuration Diagram for \NODEB PROCESSOR/DISK CONFIGURATION DIAGRAM 1 CPU GRID CPU TYPE CPU BUSY DP2 BUSY MMGR PGS NUM DP2 NUM PRI NUM BKP CPU ----[00] 10 11 [00] TXP 45.5 20.3 1715000 5 5 0 [01] TXP 43.6 18.7 650000 5 0 5 [02] TXP 36.6 20.4 625000 4 4 0 2 [03] TXP 26.9 15.5 1087000 4 0 4 3 4 6 7 8 DISK PATH SUMMARY (DP Busy % / DP Mem Pages / Disk Cache Calls) -----------------------------------------------------------------------$SYSTEM $PROD1 $PROD4 $TEST1 9.
“After Primary Changes” Sections When GPA analyzes a system, it considers whether making changes in the location of the primary disk process for each logical volume will help the overall performance of the system. If GPA determines that the performance of the system will be improved, and that there are sufficient resources available on the CPU with the backup disk process, GPA recommends changing the primary disk process to the location of the backup.
HALT IMPACT: MEMORY MEMORY MEMORY MEMORY CPU Count: 4 Avg CPU Busy (^): 58.65 Tuning Window (w): 5 PCB Count: 644 Node SWAP Rate : .57 VOLUME Count : 28 CPU FLAG EXPLANATIONS: + - Interrupt Busy M - Severe Memory Shortage m - Mild Memory Shortage P - Severe Transient Processing p - Mild Transient Processing B - Severe Transients/Memory Shortage b - Mild Transients/Mem.
CPU FLAG EXPLANATIONS: M - Severe Memory Shortage P - Severe Transient Processing B - Severe Transients/Memory Shortage Q - Moderate Memory Shortage ! - Processor MISSING From Measurement + m p b R S - Interrupt Busy Mild Memory Shortage Mild Transient Processing Mild Transients/Mem. Shortage Moderate Transient Processing Moderate Transients/Mem. Short Example 4-20 shows the difference in the CPU loads after the primary changes have been made. Compare this figure with Example 4-19.
Example 4-21.
Example 4-22. Processor/Disk Configuration Diagram for \NODEC Before Primary Changes PROCESSOR/DISK CONFIGURATION DIAGRAM CPU GRID CPU TYPE CPU BUSY DP2 BUSY MMGR PGS NUM DP2 NUM PRI NUM BKP CPU ---[00] 10 11 [00] 10 11 9 [01] 10 11 [02] 10 11 [02] 10 11 [02] 10 11 [03] 10 11 [03] 10 11 [00] TXP 62.2 20.3 195760 18 18 0 [01] TXP 44.6 18.7 96410 6 2 4 [02] TXP 69.4 20.4 437640 16 8 8 [03] TXP 58.3 15.
Example 4-23. Processor/Disk Configuration Diagram for \NODEC After Primary Changes PROCESSOR/DISK CONFIGURATION DIAGRAM CPU GRID CPU TYPE CPU BUSY DP2 BUSY MMGR PGS NUM DP2 NUM PRI NUM BKP CPU -------9 [00] 10 11 [00] TXP 62.2 20.3 195760 18 18 0 [01] TXP 44.6 18.7 964100 6 2 4 [02] TXP 69.4 20.4 437640 16 8 8 [03] TXP 58.3 15.
Process Move Recommendations In the section of the report shown in Examples 4-24 through 4-26, GPA lists the processes that you might move or switch to other CPUs to improve the load balance and memory utilization on the node. Report Considerations No report will be produced if no candidates are found. There are no user-supplied runtime options to initiate these reports; they are STANDARD reports.
Example 4-25. Process Move Recommendations for \NODEB Process Move Recommendations Primary Issue: CPU OUT OF BALANCE CPU: 1 OVER BUSY BY: Action -----MOVE MOVE MOVE MOVE MOVE MOVE MOVE MOVE Fm Cpu --1 1 1 1 1 1 1 1 Totals 8 Pin ---51 59 61 92 62 52 65 58 Process Name ------$PlAX $PlCl $PlS8 $PlSA $PlFl $PlS7 $PPSl $PlS4 23.
GPA calculates the difference in the consumption of the primary and backup processes and verifies that the switch will be successful. GPA verifies that sufficient cycles and memory are available on the backup processor to allow the switch without causing problems. (Note1: Consideration is given nodes having mixed processor types using the „Global‟ info on CPU type/subtype. Note 2: Param OVER-BUSY-BY influences process candidate selection.
Expected System Performance After Tuning Changes The next section of the report (Example 4-27 and Example 4-28) shows two charts that indicate what effect implementing the GPA tuning recommendations would have on system performance. By comparing the two sections of the report, you can see exactly how the system load would be rebalanced and how other performance parameter values would change.
PCB COUNT : TRANSIENTS : HALT IMPACT: 84 4 MEMORY 89 3 MEMORY 42 MEMORY 49 4 MEMORY CPU Count: 4 Avg CPU Busy (^): 36.2 Tuning Window (w): 8 PCB Count: 264 Node SWAP Rate : 2.36 VOLUME Count : 9 CPU FLAG EXPLANATIONS: + - Interrupt Busy M - Severe Memory Shortage m - Mild Memory Shortage P - Severe Transient Processing p - Mild Transient Processing B - Severe Transients/Memory Shortage b - Mild Transients/Mem.
TRANSIENTS : 5 HALT IMPACT: MEMORY 3 NONE 3 NONE 8 NONE CPU Count: 4 Avg CPU Busy (^): 38.1 Tuning Window (w): 8 PCB Count: 332 Node SWAP Rate : .09 VOLUME Count : 9 CPU FLAG EXPLANATIONS: + - Interrupt Busy M - Severe Memory Shortage m - Mild Memory Shortage P - Severe Transient Processing p - Mild Transient Processing B - Severe Transients/Memory Shortage b - Mild Transients/Mem.
Interpreting the Optional Report GPA enables you to select an optional report that provides substantiation for its recommendations. This report is meant to provide supporting detail on the performance implications of the system‟s configuration for users who want to more fully understand their system. Example 4-29 is a cover page to the optional report for \NODEC that shows the user‟s choice of sections. Each class chosen is listed with an entry specifying the type of section.
Optional Report Section for the SYSTEM Class In Example 4-30, you can see that the primary and backup disk processes account for the majority of processes for \NODEC. You can also evaluate the distribution by scanning across the CPU columns. In this case, CPU 0 and CPU 2 have nearly twice the number of primary disk processes as the others. You can also see that CPU 2 has only 12 backup disk processes while CPU 1 has 31.
because they hold the bulk of the primary disk processes. You can also see from the detail section that the disk processes consume 87% of the CPU cycles used by the class. The remaining three detail sections, the Send Distribution Analysis, the Receive Distribution Analysis, and the Queue Distribution Analysis, are also contained in Example 4-31. The dominant process name within the class is the primary disk process.
SYSTEM Queue Distribution Analysis Process Name -------DISK-P MONITOR VIRTUAL TMP Z0 MSENGER UnNamed -------TOTALS - Descending QueueLen Class % Cpu Cpu Cpu Cpu #00 #01 #02 #03 --- --- --- --29 2 21 3 9 6 6 6 4 4 1 1 1 --- --- --- --45 11 32 10 Cls Pct ---56 29 4 4 1 1 1 ---99 Optional Report Section for the SERVER Class A summary section for the SERVER class is shown in Example 4-32. In the case of \NODEC, the servers are evenly distributed among the processors in terms of process counts.
program RCAPS510, you can see that CPU 1 has only one copy of the program while the other CPUs have two or three. The busy distribution analysis shows that this program is using only 3% of the class‟s cycles in CPU 2. To fine tune this system, you might consider moving one copy of this program from CPU 1 to CPU 2. Example 4-33.
Example 4-34.
Implementing GPA Tuning Recommendations On the basis of its analysis, GPA makes the following kinds of explicit tuning recommendations: Moving primary disk processes to correct a load imbalance on the node. Resetting disk cache allocations to improve cache hit performance and/or reduce disk queuing. Moving processes among CPUs to relieve a detected memory shortage problem or to correct a processor utilization imbalance.
The Detail System Performance Score Reports The Detail System Performance Score Reports provide more detailed information about how GPA rates the performance of a node and its subsystems, and how it derives the final scores in the System Performance Score subsection of the System Performance Summary.
Negative Contributing Factors to CPU Score The CPU Subsystem Score is based on CPU utilization, load balancing, and performance of the processors on the node. Example 4-35 is a detailed report displaying the negative factors that contribute to the CPU subsystem score. Example 4-35. Negative Contributing Factors to CPU Score DETAIL 1Negative Contributing Factors to CPU Score Negative Factors --------2 Hi Swap 3 Memory 3 Mem/Tr. 3 Trans. 4 Disp.
(4) Disp: The dispatch rate of a CPU is over the dispatch rate limit for this CPU type. (5) OofBal: The difference of a processor percentage busy time from the average percentage busy time of all processors on the node is greater than the tolerance level. (6) Overbsy: This is a problem when the percentage busy time of a processor is above the maximum percentage busy time suggested for this type of processor.
Disk Cache Performance Score Grading The Cache Hit Rate of each disk on the node is a positive contributing factor to the disk cache performance score. The final score of the disk cache subsystem is the average cache hit rate of all volumes. Example 4-37 is a detailed report displaying the disk cache subsystem score grading. Example 4-37.
Negative Contributing Factors to Disk Volume Score This subsection of the score report clarifies the subsection Disk Volume Subsystem Performance Score of the System Performance Summary. The disk volume subsystem score is based on the performance and queue time of all disks. Example 4-38 is a detailed report displaying the disk volume subsystem score. Example 4-38.
(5) Overbs: An overbusy disk with high queue time or a disk with high queue time and its backup on a slower processor are considered overbusy. (6) Pcache: A disk with high request queue time and cache hit rate lower than the low limit of the cache hit rate is a disk with poor cache. (7) Queued: A disk that has request queue time greater than the limit is considered a disk with high queue time. (8) R:C <1: The ratio of disk requests to cache requests less than 1.
CPU Failure Simulation Example 4-40 is a detailed report displaying CPU failure simulation. This report gives a full picture of how the other processors in a system are affected when a processor fails. Additional CPU and memory demands are detailed. Example 4-40. CPU Failure Simulation DETAIL CPU Failure Simulation Impacted CPU CPU #00 #01 --- --Fail CPU #00 Busy Meg CPU #01 Busy 24 Meg 2.0 CPU #02 Busy Meg CPU #03 Busy Meg CPU #04 Busy Meg CPU #02 --- CPU #03 --- CPU #04 --- 26 1.
Server Process Analysis for the Individual CPUs Example 4-41 is a detailed report displaying the Server Process Analysis for CPU #00. Example 4-41.
Example 4-42 is a detailed report displaying the Server Process Analysis for CPU #04. Example 4-42.
Dynamic Server Process Analysis Example 4-43 is a detailed report displaying the dynamic server process analysis. Dynamic servers are a subset of transient processes representing transient processes that have members (same program file name) in the server class. Example 4-43.
Disk Cache Change Analysis Example 4-44 is a detailed report displaying the disk cache change analysis. Example 4-44.
CPU Cache Change Analysis Example 4-45 is a detailed report displaying the CPU Cache Change Analysis. Example 4-45.
Error Reports The final kind of report that GPA provides is the error report which GPA writes to the GPALOG.101 file. The GPA Error Report informs you of system errors and diagnoses them. There are two types of errors that can occur: Fatal errors that cause GPA to terminate. Non-fatal errors, on which GPA bases its performance-enhancing recommendations. Example 4-46 is an example of an error report that contains both fatal and non-fatal errors. Example 4-46.
Glossary #OUT The GPA output file. blocked request A request that cannot be processed because another application has blocked access to a record or file. cache A portion of memory used to store frequently-accessed information in order to save the time otherwise required for disk I/O operations. cache call A request for disk data expected to be found in cache. cache fault An event that occurs when a disk process expects to find a data block in cache and discovers that the memory manager has removed it.
GPA The program module that performs the system analysis. index level In a key-sequenced file, the B-tree structure for minimizing access time consists of one or more index levels. MEASCOM The command interface used to access Measure. MEASFH A Measure file handler process that builds counter records from the data in the measurement data file. Measure The NonStop system performance monitoring product. message Information sent by one process to another process. This may be a request for service or data.
PIN A Process Identification Number is the numeric value that identifies a process running on a CPU. PUPBAK A PUP command file that restores a system to its original measured state. PUPIN A PUP command file that contains PUP PRIMARY and PUP SETCACHE commands for implementing GPA tuning recommendations with regard to disk and cache. PUP PRIMARY command A command used to assign the primary CPU for a disk process. PUP SETCACHE command A command used to allocate or change cache blocks for a disk volume.
SCFIN A SCF command file that contains SCF PRIMARY and SCF ALTER DISK, CACHE commands for implementing GPA tuning recommendations with regard to disk and cache. static process control block A Process Control Block (PCB) dedicated to a single process for the duration of the measurement period analyzed by GPA. system recovery The condition whereby a system continues to function normally when a processor failure occurs.