
Guardian Performance Analyzer (GPA) User Guide


Guardian Performance Analyzer (GPA) User Guide – (544541-006) Page 105 of 131
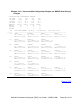
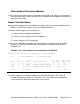
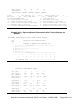
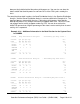
Expected System Performance After Tuning Changes
The next section of the report (Example 4-27 and Example 4-28) shows two charts that
indicate what effect implementing the GPA tuning recommendations would have on
system performance. By comparing the two sections of the report, you can see exactly
how the system load would be rebalanced and how other performance parameter
values would change.
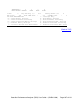
Notice that the memory shortage in \NODEA is so severe that even the GPA process move
recommendations would not correct this condition. In such a case, a complete
hardware configuration analysis should be performed. (For more information on this
type of analysis, contact your NonStop system Representative.)
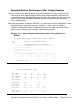
Example 4-27. Expected System Performance After Tuning Changes for
\NODEA
ESTIMATED PERFORMANCE PROFILE AFTER TUNING CHANGES
CPU PROCESSOR LOAD BALANCE CHART
NUM
--- ROUNDED TO NEAREST TWO PERCENT (2%)
|----+----+---wwww^wwww--+----+----+----+----+----|
0 |+++----------->M ^
1 |++++++-----------^------------->Q
2 |+++--------------^>
3 |++----> ^
|----+----+---wwww^wwww--+----+----+----+----+----|
0 1 2 3 4 5 6 7 8 9 1
0 0 0 0 0 0 0 0 0 0
0
CPU PERCENT BUSY -------------------------------->
PROCESSOR PERFORMANCE CHART
CPU NUM : 0 1 2 3
CPU TYPE : TXP TXP TNSII TNSII
MB MEMORY: 8 8 8 8
PCT BUSY : 30.42 66.04 38.01 15.70
DISK PRIME : 4 0 5 0
DISK RATE : 11.9 6.8
CHIT RATE : 14.3 7.8
MSG RATE : 37 21 16 6
DISP RATE : 117.3 111.1 69.7 29.8
SWAP RATE : 1.26 .93 .17
MMGR PAGES : 1137 58 747 1305